XRP/USDT(UPDATE)Hello friends
Given the price growth we had, we can enter into transactions within the specified limits with capital and risk management and move towards the specified goals.
*Trade safely with us*
XRPBULLUSDT trade ideas

Ripple (XRP): Possible Zone of Rejection | April 2025Ripple has reached the resistance zone, which has aligned with the 200EMA, forming a strong resistance zone.
We are looking for some kind of MSB to form here, which can give us a good entry for a short position.
Swallow Academy

XRP looking super bullishXRP has broken 2 points of resistance and has created some great support. I think we have potential for a 20%+ increase over the next few weeks. Still a long-term hold for me. It's never too late to get in. Not financial advice. :)

BUY XRP - SWING TRADE TO $6BUY XRP - SWING TRADE TO $6+ - OPPORTUNITY TO ACCUMULATE THIS POTENTIAL TOKEN IN 2025
TRADING STRATEGY
Type: SPOT (No Leverage)
Using SPOT trading will help you avoid liquidation risks and comfortably hold through market volatility for extended periods.
Holding Period: SWING
Planning to hold XRP for 3-6 months to capitalize on the long-term uptrend, aligning with market cycles and developing fundamentals.
Risk Management
Entry Point: Buy at current levels ($2.10-$2.20) or wait for pullback to support zone $1.85-$2.00
Take Profit:
TP1: $3.00 (+40%)
TP2: $4.20 (+100%)
TP3: $6.00+ (+185%)
Goodluck!

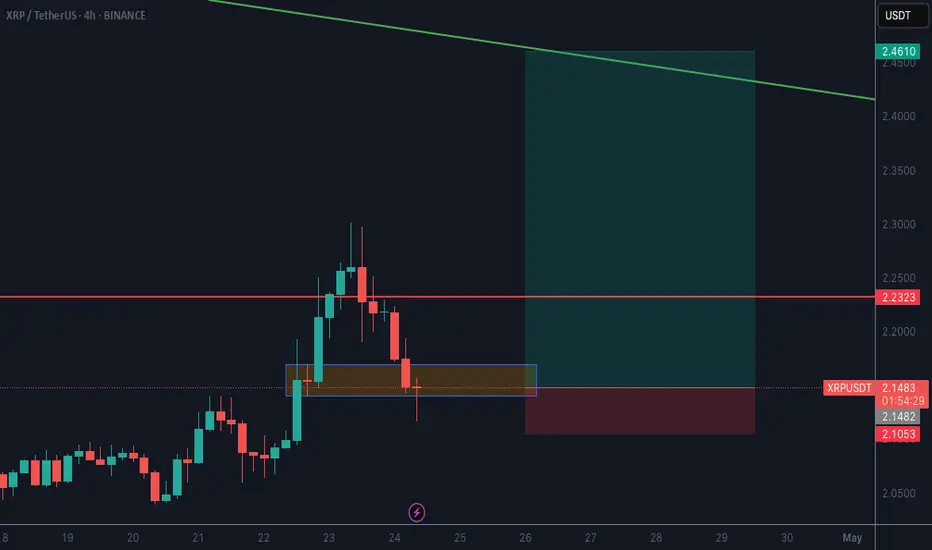
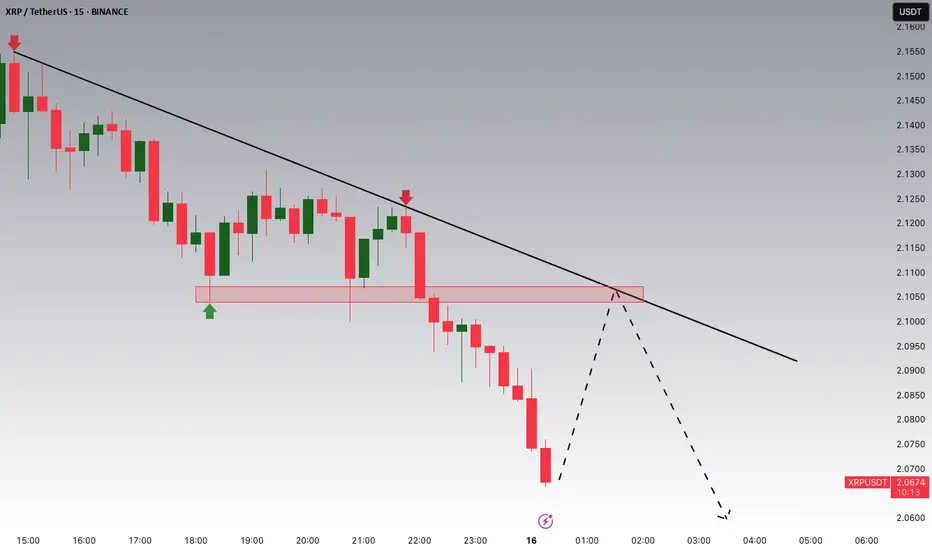
Watching $2.10 for a Potential XRP ReversalRipple (XRP) is currently trading within a clear downtrend, and we’re now seeing a corrective move that’s pushing price back toward a key zone around $2.10, which has acted as both support and resistance in the past.
This area aligns closely with the descending trendline, making it a strong confluence zone to watch for a potential bearish reaction.
XRP - Choppy Market, Will We See $1.5 Again?After finishing the 5-wave structure in early 2025, XRP had a rough patch, trading between $3 and $2 and offering some pretty neat swing trade opportunities. Now, two months later, the big question is: will this range continue, or is a breakout on the horizon? Let’s break down the key levels and high-probability setups.
Short Trade Setup
Resistance Zone:
The weekly level and the 0.618 Fibonacci retracement are both around $2.5763 to $2.5792, aligning nicely with each other.
The anchored VWAP from the all-time high at $3.4 adds extra resistance at about $2.63.
Setup Details:
A low-risk short trade can be considered at the weekly level, with a stop-loss set above both the anchored VWAP and the swing high.
Target: The monthly open, aiming for an R:R of about 4:1.
Support Backup:
Additional support in this range comes from the 0.618 Fibonacci retracement (from a low at $1.9 to a high at $2.59), the weekly 21 SMA at $2.28, and a weekly level at $2.0942 just below the monthly open.
This support between the weekly level at $2.0942 and the monthly open is crucial for maintaining bullish momentum. If it holds, the bearish short setup stands; if it breaks, things could get tricky.
Long Trade Setup
When to Consider a Long:
If the support zone mentioned above fails, look for a long trade opportunity at the swing low around $1.77.
Support Confluence:
Primary Support: The swing low at $1.77, with lots of liquidity around that area.
Additional Layers:
The monthly level at $1.5988.
The weekly level at $1.5605 sits just below the monthly.
The 0.618 Fibonacci retracement from the 5-wave structure at $1.5351.
Anchored VWAP from the low at $0.3823, aligning with the weekly level.
And don’t forget the psychological level at $1.5.
Setup Details:
This long trade setup would offer an attractive R:R of roughly 6:1, targeting back to the monthly open for an approximate 33% gain, with a stop-loss placed below the $1.5 mark.
XRP's current trading range has provided some good short and long trade setups, a long opportunity at the swing low ($1.77-$1.5) could be the next big play. Whether you lean towards short or long, finding these confluence zones helps in making more informed, high-probability trade decisions.
If you found it helpful, please leave a like and a comment. Happy trading!

XRPUSDT – Liquidity Hunt Incoming? Watch the Equal Highs!Description:
Price is moving within a rising channel, heading toward a key liquidity zone sitting right at the golden pocket and just below equal highs . This confluence makes it a prime area for a potential fakeout and reversal. I'm watching for a liquidity grab above , followed by a sharp rejection .
🟦 Rising channel structure
🟨 Golden Pocket + Liquidity Zone
📏 Equal highs = potential trap
🔻 Bearish reversal setup forming
Keeping a close eye for signs of rejection at the top. Could be a nice short opportunity.
What’s your take? Bull trap or breakout?

XRP/USDT I Reverse Short Squeeze Alert! Resistance at 2 USDTHey Traders after the success of my Previous trade this month on NASDAQ:HOOD hitting Target 1 & 2 in 2 days more than 16%+
With a Similar Trade setup But Crypto I bring you today
BINANCE:XRPUSDT
Short opportunity
- Market structure
- Head and shoulder pattern
- Currently will be trading at supply zone which was a recent support and now an ideal place for a reversal which is taking place as we speak- 4 Hour TF.
- Breakdown and retest
- Risk Aversion Dynamics in Cryptocurrency Markets
PROTIP/-
Entry on Bearish candle stick pattern on Current Levels
Stop Loss : 2.2292
Target 1 : 1.4707
Target 2 : 1.0507
Technical View
The orange circle marks a double top within the supply zone, acting as the shoulders of a larger head and shoulders pattern, suggesting strong resistance.
Bearish Trendline
breakdown + Retest
Risk Aversion Dynamics in Cryptocurrency Markets
Fundamental View - How Current Affairs can effect this pair!
The proposed imposition of significant tariffs, such as the 60% levy on Chinese imports suggested by former U.S. President Donald Trump, could trigger a chain reaction across global markets. This scenario would likely amplify risk aversion among investors, potentially catalyzing a sell-off in risk-sensitive assets like XRP (Ripple) in favor of perceived safe havens such as the U.S. dollar (and by extension, Tether/USDT). Below, we analyze the mechanics of this relationship and its implications for the XRP/USDT trading pair.
1. Tariff Escalation and Its Macroeconomic Consequences
1.1 Direct Impact on China’s Economy
A 60% tariff on Chinese exports to the U.S. would directly reduce China’s export competitiveness, potentially lowering its GDP growth by 1.5–2.5 percentage points annually, according to UBS economists. This slowdown would exacerbate existing vulnerabilities in China’s economy, including a property market crisis, weak domestic demand, and deflationary pressures (June 2024 CPI: 0.2% YoY). Reduced economic activity in China—the world’s second-largest economy—could dampen global trade volumes and commodity prices, indirectly affecting risk sentiment in financial markets.
1.2 Global Spillover Effects
The UBS analysis highlights that retaliatory measures by China or other nations could amplify trade fragmentation, further destabilizing supply chains and corporate earnings. For example, the April 2025 announcement of 25% U.S. tariffs on automotive imports triggered a 2.9% drop in the S&P 500 and a 5–7% decline in major Asian equity indices. Such volatility often precedes broader risk aversion, as investors reassess exposure to growth-dependent assets.
2. Risk Aversion Dynamics in Cryptocurrency Markets
2.1 Flight to Safety and USD Appreciation
During periods of economic uncertainty, capital typically flows into safe-haven assets like U.S. Treasuries and the dollar. Tether (USDT), a stable coin pegged 1:1 to the USD, often benefits from this dynamic as crypto traders seek stability. For instance, Bitcoin’s role as a “weak safe haven” for the USD in acute crises suggests that stable coins like USDT could see increased demand during tariff-induced turmoil, while altcoins like XRP face selling pressure.
2.2 XRP’s Sensitivity to Risk Sentiment
XRP, unlike Bitcoin, lacks established safe-haven credentials. Its price action in Q2 2025 exemplifies this vulnerability: a 7.5% decline over 30 days (peaking at 2.57 USDT on March 19 and bottoming at 1.64 USDT on April 7). This volatility aligns with broader patterns where altcoins underperform during risk-off periods. A global slowdown would likely intensify this trend, as retail and institutional investors reduce exposure to speculative crypto assets.
3. Mechanism: From Tariffs to XRP/USDT Price Decline
3.1 Investor Behavior in Risk-Off Environments
Tariff Announcements → Equity Market Sell-Off: The April 2025 auto tariffs caused a 6–7% drop in Asian equities, signaling growing risk aversion.
Liquidity Reallocation: Investors exit equities and crypto (including XRP) to hold cash or cash equivalents like USDT.
USD/USDT Demand Surge: Increased demand for USD lifts USDT’s relative value, pressuring XRP/USDT downward.
3.2 Technical and Fundamental Pressure on XRP
Supply-Demand Imbalance: As sellers dominate XRP markets, the token’s price in USDT terms declines. The 14.56% 90-day volatility in XRP/USDT suggests heightened sensitivity to macroeconomic shocks.
Liquidity Crunch: A broader crypto market downturn could reduce trading volumes, exacerbating price swings.
4. Historical Precedents and Limitations
4.1 Bitcoin’s Mixed Performance as a Hedge
While Bitcoin has shown limited safe-haven properties for the USD in short-term crises, its decoupling from altcoins like XRP during stress periods is well-documented. For example, Bitcoin’s 40% rebound post-COVID crash contrasted with XRP’s prolonged slump in 2020–2021.
4.2 Mitigating Factors
Stimulus Measures: If China implements aggressive fiscal stimulus, as UBS posits, a partial recovery in risk appetite could cushion XRP’s decline.
Crypto-Specific Catalysts: Regulatory clarity or Ripple-related developments (e.g., SEC case resolutions) could counteract macro-driven selling.
5. Conclusion: Bearish Outlook for XRP/USDT in Tariff Scenario
In a tariff-driven slowdown, the XRP/USDT pair faces downward pressure due to:
Risk Aversion: Capital rotation from crypto to stable coins.
USD Strength: USDT demand surges as a proxy for dollar safety.
Altcoin Underperformance: Historical precedent of XRP lagging during macro stress.
People interested should monitor China’s policy response and U.S. tariff implementation timelines, as these factors will determine the severity of XRP/USDT’s downside. A breach below the April 7 low of 1.64 USDT could signal prolonged bearish momentum.
This analysis synthesizes macroeconomic triggers, market psychology, and cryptocurrency-specific dynamics to outline a plausible pathway for XRP/USDT depreciation amid escalating trade tensions.
Not An Investment Advise

XRPUSDT SELL/SHORTBy utilizing levels, historical patterns, , we can formulate a hypothesis that the market might follow a similar trajectory if bearish sentiment prevails.

XRP 5X Lev. Full PREMIUM Trade-Numbers (PP: 1380%)Good afternoon my fellow Cryptocurrency trader, this is a great weekend and a wonderful day.
The bullish bias for XRP has been confirmed more than enough. It is time. The time is right and the time is ripe to go LONG.
I am publishing to give you full trade-numbers for you to enjoy.
This is a high probability chart setup.
I am wishing you success and great profits. Crypto is going up.
We are doing mid-leverage on this pair. We are going with 5X because the action is already moving. Earlier, we would go higher, but we like to keep risk moderate.
Full trade-numbers below:
_____
LONG XRPUSDT
Leverage: 5X
Current price: $2.15
Entry levels:
1) $2.18
2) $2.12
3) $2.05
4) $1.98
Targets:
1) $2.50
2) $3.02
3) $4.51
4) $6.29
5) $8.08
Stop-loss:
Close weekly below $1.95
Potential profits: 1380%
Capital allocation: 5%
_____
I am wishing you great profits and tons of success.
This is for advanced traders.
You decide how to secure profits, how to adapt to market conditions and how to trade.
You also decide your own level of risk. If you win, all the profits are yours.
If you lose, that's ok, the market offers endless opportunities and life goes on.
It is not about winning them all. It is about winning and growing.
Thanks a lot for your continued support.
Namaste.

XRP correction incoming ? Neckline will not hodlthe neckline will not hold and will probably make XRP return to it's previous support around 1.60usd. Feel free to comment <<<

The last bullish chance of RIPPLE in Mid term!The price has formed a bullish wedge on the daily time frame, and if it breaks out, it can drive the price up to around $3 . I don't know why this coin reminds me of BNB!!!
Give me some energy !!
✨We spend hours finding potential opportunities and writing useful ideas, we would be happy if you support us.
Best regards CobraVanguard.💚
_ _ _ _ __ _ _ _ _ _ _ _ _ _ _ _ _ _ _ _ _ _ _ _ _ _ _ _ _ _ _ _
✅Thank you, and for more ideas, hit ❤️Like❤️ and 🌟Follow🌟!
⚠️Things can change...
The markets are always changing and even with all these signals, the market changes tend to be strong and fast!!

XRP Long Swing Setup – Key Support IncomingXRP is pulling back and now approaching a critical support zone between $1.85 - $2.00. This area has historically acted as a launchpad for bullish momentum, and with the broader market eyeing a bounce, it offers a strong risk-to-reward opportunity.
🛒 Entry Zone:
$1.85 – $2.00
🎯 Take Profit Targets:
🥇 $2.20 – $2.35
🥈 $2.60 – $2.75
🛑 Stop Loss:
Just below $1.70 (keep an eye on daily candle closes)

XRPUSDT 1DXRP ~ 1D Analysis
#XRP Buy after successfully penetrating this resistant line with a short -term target of at least 10%+ from here.

Why it is a good idea to start shorting XRP at $2.16 (4/12)Two clear distribution channels on the daily timeframe that have harmed a lot of retail investors FOMOing in.
Scenario 1: XRP continues its trajectory in the downward distribution channel, potentially dumping to the downside at any time
or
Scenario 2: Reversal of downwards channel with price trending upwards for an extended period on the daily (most likely in the bottom half of the upward channel)

XRP Update: Full Analysis & 8X LONG Entry LevelsThe 3-Feb. low has been pierced. Notice the same chart with the same numbers extracted months ago. This is important because the action keeps happening around those levels.
XRPUSDT moved below the 3-Feb. low/support but closed above it. Then it was challenged again yesterday but the session ended as a higher low compared to 7-April and green. This means that the low is in.
We have a technical double-bottom and a long-term test of support. More than four months of sideways action. The stage is set for bullish growth.
We are already ready and active here with an 8X LONG. Entry levels go from $1.75 to $1.96. Just sharing for your info and convenience.
Yesterday's session was full green and negated the two sessions preceding it. This is a shakeout or stop-loss hunt event. This is a bullish signal if we see it as a failed signal. Bears tried to push prices below support but failed. Another way to look at it; XRPUSDT is trading above support and within the bullish zone. Both are good and pointing toward higher prices.
The weekly timeframe reveals a hammer candlestick after the lowest price in months, since November 2024. See here:
The hammer is an early reversal signal. Once confirmation is in, a change of trend is confirmed. Confirmation comes when several sessions close green after the signal shows up.
Finally, we have marketwide action and related markets.
Cardano produced the same pattern but with a higher low in April rather than a lower low.
Bitcoin is bullish and strong, trading back above 80K.
Nvidia is bullish as well as the SPX. So the correction is over and this is a valid, informed, wise and logical assumption, because the market was down for more than four months.
XRPUSDT has beeen clearly sideways, it still is. But sideways means no growth.
So, a rise starts in early November 2024. It reaches maximum momentum in early December and then slows down but still grows. Going a bit higher in early January and then a minor correction phase. The correction produces a low followed by another low, double-bottom; the main move is a bullish jump starting in November. This is the move that is being corrected and consolidated. Once the action resumes, it will resume what was already happening. Up.
If the market was bearish and set to move lower and continue lower, we would be seeing a steep decline, lower highs and lower lows. Instead, we have a perfect sideaways pattern which tends to show up before additional growth.
XRPUSDT will grow strong, mark my words.
The time is now. Mange your risk but feel free to go LONG (experts only).
The rest of the participants can accumulate (buy) like it is the end of the world.
You should be buying now; buy, buy, buy... Once the action resumes, there is no going back. This is your chance.
We caught the late 2024 bullish wave, we will also catch this one; and then next and so on ad-infinitum.
Thanks a lot for your continued support.
It is my pleasure to write for you. We've been trading XRP together since December 2017.
It has been a great ride.
Feel free to follow me.
Namaste.

XRP, Bloodbath is ComingBINANCE:XRPUSDT / 1D
Hello Traders, welcome back to another market breakdown.
BINANCE:XRPUSDT is showing strong bearish momentum after BINANCE:BTCUSD and BINANCE:ETHUSD broken bellow resistance. However, the price is oversold for now. Hence, instead of jumping in at current levels, I recommend waiting for a pullback into the high of the range zone for a more strategic entry.
If the pullback holds and sell off confirms, the next leg higher could target:
First Resistance: Immediate levels formed during prior consolidation.
Stay disciplined, wait for the market to come to you, and trade with confidence!
Trade safely,
Trader Leo.

XRP Short Term Analysis (4H)XRP is exhibiting bullish signals supported by multiple technical indicators.
An Inverse Head and Shoulders pattern has clearly formed on the chart, indicating a potential reversal from the previous bearish trend. Additionally, the downward trendline appears to be breaking out with increasing volume, which reinforces the breakout confirmation.
From an Elliott Wave Theory perspective, we seem to be in wave 3, which is typically the most impulsive and extended leg of the five-wave cycle.
Given the structure and momentum, a conservative price target lies at the $2.30 level, representing the measured move from the neckline of the H&S formation.
Further upside may follow if wave 3 unfolds as expected, but short-term corrections should also be anticipated.
Risk management remains essential, as macroeconomic factors and fundamental news may cause volatility.
— Thanks for reading.

XRP May Collapse During This CycleXRP has a giant head and shoulders formation in daily chart.
If it breaks 2$ level support zone, XRP may lose at least -%30 of it's value.
You can use it for short.
Safe entry would be below 2$ with a closeure of daily candle.
Or.. Simply short right from here but it would be risky.

Crypto XRPUSD Bear Bull Zone! What is Ripple Xrp next Big move? 🌎 Crypto XRPUSD Bear Bull Zone! What is Ripple Xrp next Big move?
🟢SeekingPips🟢 Says...
"when levels are as clean as this we can always use one of our intermediate TIMEFRAMES".
In todays case that task falls onto the 📉 120 MINUTE CHART📈
The GREY ZONE is our BIAS going forward for at least the next 48 HOURS.
Therefore 🟢 SeekingPips 🟢 is strictly BULLISH ABOVE & BEARISH BELOW the GREY ZONE.
🚥 SIMPLICITY is a KEY ingredient to having LONGEVITY in the FINANCIAL MARKETS 🚥

$XRP broke structure to the downsideCRYPTOCAP:XRP broke structure to the downside on the weekly, tapped into the red resistance box, and is getting rejected.
Unless CRYPTOCAP:BTC and the market keep pushing, this one’s got work to do — better charts out there IMO.

Update to my last chartThis is an update to my last chart. We are moving along nicely. lines are resistance and support. Not financial advice. Have a blessed day!!

XRP Long Pull back into demand zone between 2.1237 and 2.17.
Expecting a reversal from this area. Good long opportunity.