On track for $4.40The whales have done a really great job so far scaring normal people out of the market while they buy it up at the bottom. There have been quick obvious whale sells, and tricky slow sells. But in the end through CBS and MSNBC doing hit pieces, editing and censoring Garlinghouse, Jerome at the federal reserve announcing a cut in rate cuts. It is still trading within the cone, though it did break the bottom of the cone, but I believe that was whale manipulation. I think it still looks on track for $4.44.
XRPBULLUSDT trade ideas

XRP - What if?What if the drawing i drew on the day of new year proves to be of very good trades? You to choose, you to trade, you to understhand!

XRP buy idea technicalIt is possible to expect a slight upward movement, even if not with strong momentum, as it is currently at a support level.

XRP Bullish FlagXRP 1d
Mark-up liquidities on both sides, price is currently printing a bullish flag pattern. FVGs also highlighted and a demand zone sitting around the $1.40 zone. MA21 is currently acting as dynamic resistance along the trendline. Last time it acted as support, price saw a 43% increase. A breakout on the MA21 might signal a bullish continuation for XRP, whilst a breakdown to mitigate the Demand Zone will offer a good buy-in.

Decion making for xrpIts time for Xrp to do some decision making two scenarios can be expected...
Simple
Up or down
Seeing no sign of bullish momentum were still correcting, making higher lows and lower lows..however we can't be fully predictive yet we react I still see a slim chance to go upward based on past price action.
To wrapp it up It will go up when you least expect it keep a close eye ,don't complicate things wait for the break,, either ways ..stopp loss and let it run
Happy new years
good luck

XRP's Dip Before the RipSo heres my prediction regarding when XRP will be expected to see this much anticipated rip up the charts. If it breaks below the support line then expect it to happen at the next support but either way... it's coming.


XRPIf it breaks out of this descending pattern .
And retest it .
My short term targets would be 4,4$ - 4,8$.
* Correction to previous ath 2,9-3,3$ ( not everybody agrees on what it actually is ) .
And on to +8$

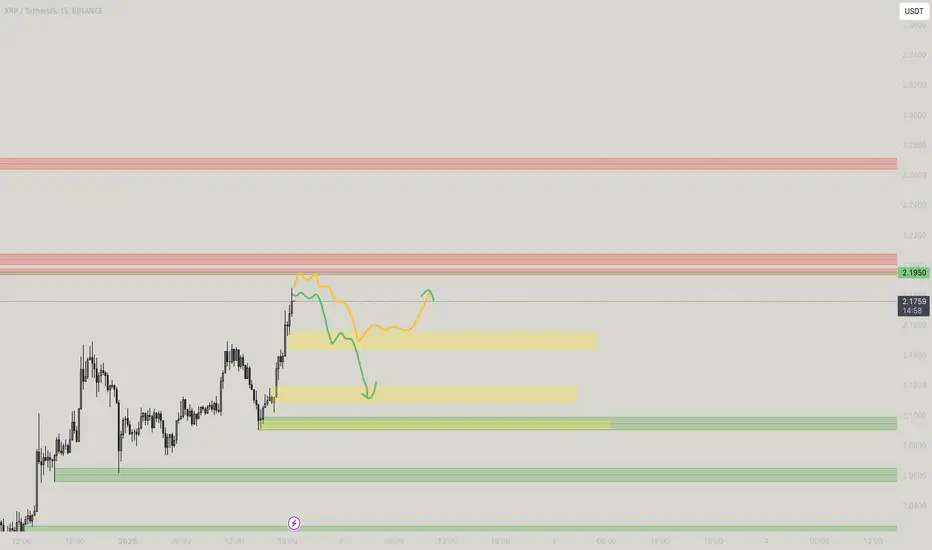
XRP 1 HR POSSIBLE SCENARIOS 🚨 XRP 1-Hour Analysis 🚨
Here’s what we’re watching:
📈 Upside Targets:
• TP1:2.190
• TP2: 2.235
📉 Downside Targets:
• TP1: 2.08
• TP2: 2.04
So we have to watch out for level. If XRP stays below 2.12 - 2.14 then you can target downside targets and if above then you can target above levels mentioned as TP(take profit)
Keep an eye on key levels and trade smart! 💹

XRP about to hit all Time High ... butIn this video, I talk about my expectations for the next XRP movements. The price will likely take out liquidity points, go into an accumulation phase in the short term, and then trade towards the all-time high. I also discuss the relationship between BTC and XRP.

XRP - Descending TriangleFormed a descending triangle, the price broke through the support on the daily TF and consolidated. The target for the decline is $1.6

25.12.2024: XRP/USDT – Consolidation or Breakout?📊🚀 What’s Next for XRP? Let’s Analyze!
Key Levels to Watch
🔼 Resistance:
$2.40 (0.786 Fibonacci): Immediate resistance. A breakout above this could target higher levels like $2.65–$2.93.
$2.93 (1.0 Fibonacci Extension): The swing high and ultimate bullish target for continuation.
$3.00: Psychological level
🔽 Support:
$2.06–$2.00 (0.618 Fibonacci): Critical and support zone. A breakdown here could start a fall towards $1.68 (0.5 Fibonacci).
$1.98 (Psychological Level): Aligns with prior rejections and forms the lower consolidation boundary.|
Current Observations
📈 Trend Overview:
Price is consolidating between 0.618 ($2.00) and 0.786 ($2.40) Fibonacci levels.
EMAs reflect indecision: Price is sandwiched between the 20 EMA (orange) and 50 EMA (blue), but 100 EMA and 200 EMA are sloping upward, indicating a bullish trend on higher timeframes.
📊 Indicators:
RSI: Neutral (~50), signaling no strong momentum yet. Watch for a breakout above 60 for bullish confirmation or below 40 for bearish momentum.
Volume: Decreasing during consolidation, signaling potential buildup for a larger move.
Trade Scenarios
💹 Bullish Setup:
Entry: On breakout above $2.40 with strong volume.
Stop-Loss: Below $2.30 (to avoid false breakouts).
Take-Profit:
First target: $2.65
Second target: $2.93
📉 Bearish Setup:
Entry: On breakdown below $2.00 (0.618 Fibonacci).
Stop-Loss: Above $2.10.
Take-Profit:
First target: $1.68 (0.5 Fibonacci).
Second target: $1.39 (0.382 Fibonacci).
Summary
XRP is currnelty consolidating. Bulls need a breakout above $2.40 for further grow to $3.00, while bears could take over, if the price breaks below $2.00.
P.s. Whales are buying XRP:
25.12.2024 - price is 2.29 and 5.07B buying.
vs 03.12.2024 - price is 2.87 and approx. 4.67B buying.
Are you bullish or bearish on XRP? Share your vision in comments ;)

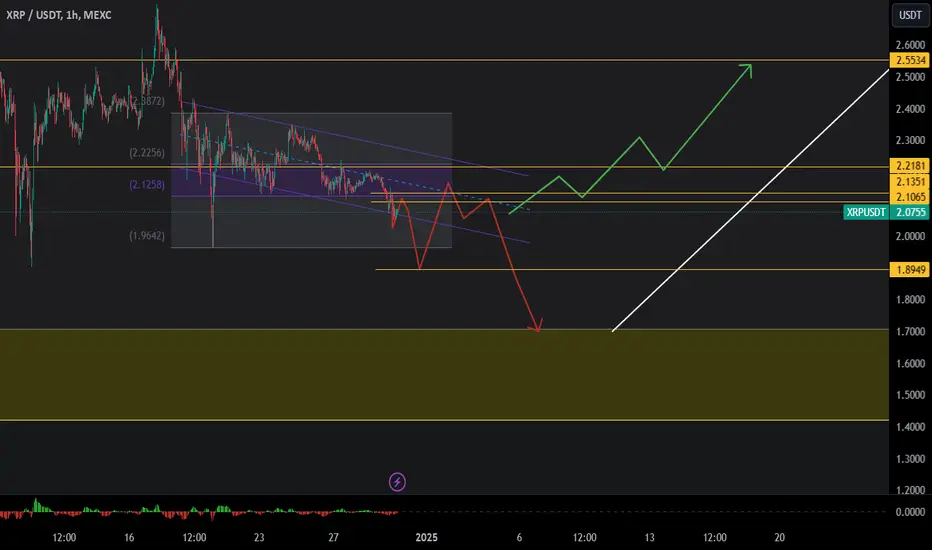
xrp update 1 hourupdate xrp usdt 1 hour chart
dont overpower the trade en look what the price action tells
have a nice day!
Disclaimer: Think carefully before making an investment and never invest more than you could afford to lose. We at legendsoffcrypto do not provide financial advice and are not responsible for any financial loss. The content we offer has purely entertaining and educational value.
XRP Buy the incoming dump (1.42 $)I'm expecting a huge dump in crypto market in the upcoming days, and I believe it's the best time to buy since I'm I believe the trend is too powerful to end now.
Place your buy orders on 1.42 $ which is a very strong level in my opinion: Daily order block + 61.8 fibbo level.

Analysis of XRP/USDT Chart:Analysis of XRP/USDT Chart:
Key Observations:
Current Trend:
The chart shows a retracement phase after a significant rally, consolidating within a range between $2.00–$2.40.
Lower highs and retests of order blocks suggest cautious bullish sentiment, with potential for further downside before continuation.
Key Technical Zones:
Bullish Order Block (OB):
Around $2.10–$2.13: This zone aligns with a discount price range and has previously acted as a strong demand area. Likely to attract buyers again.
Bearish Order Block (OB):
Around $2.40–$2.70: This resistance zone suggests strong supply pressure. For upside continuation, price needs a decisive break above this level.
Fair Value Gap (FVG):
There is a gap around $2.15–$2.20, indicating inefficiency in price action. This could be a magnet for price to revisit and fill before further movement.
Fibonacci Retracement Levels:
The retracement aligns with key levels:
50% Level: Around $2.15.
61.8% Level: Around $2.00, coinciding with structural support and a bullish OB.
Possible Entries:
1. Bullish Entries:
Zone: $2.10–$2.13 (Bullish OB):
Look for bullish price action confirmation (e.g., rejection candles or a strong rally) at this level.
Stop Loss: Below $2.00 (to avoid false breaks).
Target 1: $2.40 (Bearish OB resistance).
Target 2: $2.70 (next resistance).
Zone: $2.00–$2.05 (Deep Discount Zone):
If price overshoots the OB, this deeper zone aligns with the 61.8% Fib retracement and prior structural lows.
High-probability entry for long trades.
2. Bearish Entries:
Zone: $2.40–$2.70 (Bearish OB):
Look for bearish confirmations, such as rejection patterns, to short from resistance.
Stop Loss: Above $2.70.
Target 1: $2.15.
Target 2: $2.00.
Probability Scenarios:
Bullish Continuation:
If price holds above $2.10, a breakout above $2.40 is likely. This could lead to a rally toward the next significant resistance at $2.70–$3.00.
Probability: Medium (Requires bullish macro catalysts).
Bearish Retracement:
If price breaks below $2.10, expect a deeper retracement toward $2.00 or lower, aligning with Fibonacci support and prior OBs.
Probability: Medium-High (If market sentiment or macro factors remain weak).
Range Consolidation:
If price remains between $2.10–$2.40, consolidation could continue until a breakout is triggered by macro or technical factors.
Probability: High (Current structure suggests indecision).
Macro and Sentiment Drivers:
Market Sentiment:
Bullish sentiment in the crypto space (e.g., Bitcoin rally) will likely support XRP's upward movement.
Negative sentiment, such as SEC-related developments or broader market corrections, could drive XRP lower.
Regulatory News:
Any updates on Ripple's legal battles (e.g., SEC cases) will strongly impact price.
Adoption and Partnerships:
Positive news about Ripple’s adoption by financial institutions or cross-border payment networks could boost price.
Broader Crypto Market:
Watch Bitcoin dominance and altcoin performance. XRP tends to follow broader market trends during strong bullish or bearish phases.
Recommendation:
Bullish Bias:
Enter at $2.10–$2.13 or $2.00–$2.05 with a tight stop loss and targets near resistance zones.
Bearish Bias:
Look for rejections at $2.40–$2.70 to short with targets near $2.15 or $2.00.


Xrp long termXrp for the long term support levels level 1 1.8486
Level 2 1.6759
And de last one must hold is Level 1.3058
The levels to gain Level 2.2003
The level to gain for the moonshot Level 2.6629
Disclaimer: Think carefully before making an investment and never invest more than you could afford to lose. We at legendsoffcrypto do not provide financial advice and are not responsible for any financial loss. The content we offer has purely entertaining and educational value.

XRP Long 1$- Price just took out the High and drove FOMO buyers into buying a potential breakout.
- With price dumping afterwards all stops have been ran and price does came back into the initial CISD level.
- This is the optimal long trade entry level with market being in total fear right now.
Take care and good luck.

Will history repeat itself? Somehow found this pattern oddly similar to the November pump. and looking back, its building up to something. ;)

XRP Short-terma huge drop is coming
A significant short-term drop in XRP is likely as the market opens. Proceed with caution.

XRPUSDT 1WXRP Update ~ 1W
#XRP So far it continues to maintain its bullish structure. This is Wave 2 of the correction. Buy gradually within this support Block,. for wave 3 of the next increase.

XRPUSD Chart Analysis: Key Patterns and Price PredictionsHere’s a complete list of patterns and observations of what I see in the chart:
1. Symmetrical Triangle (Current Pattern):
• The price is consolidating with lower highs and higher lows, forming a symmetrical triangle. This is typically a continuation pattern, and given the prior uptrend, an upward breakout is more likely.
2. Ascending Channel (Previous Trend):
• Before the current consolidation, the price exhibited higher highs and higher lows, forming an ascending channel that indicates a strong bullish momentum.
3. Double Top Potential:
• The chart shows a possible double top forming near the resistance zone of $2.25. If the neckline (support level) breaks, it could signal a bearish reversal.
4. Bullish Flag (Earlier in the Uptrend):
• Earlier in the trend, there’s a sharp upward movement followed by a slight pullback in a parallel channel, forming a bullish flag, which is a continuation pattern.
5. Golden Cross (EMA Crossover):
• The EMA 55 (yellow line) crossing above the EMA 144 (blue line) earlier in the trend suggests a golden cross, a strong bullish signal.
6. Support and Resistance Levels:
• Key resistance is visible at $2.25, while support is around $2.10. These levels are crucial for determining whether the price will break out upward or downward.
These patterns provide a detailed picture of XRP’s current and prior price actions, highlighting both bullish and bearish possibilities based on key levels and formations.
