Price PredictionI painted the first fib retrace and subtracted about 1% from the 2.618 line and it was 4.444 I subtracted another 1% to start the next fib retrace, then another 1% of of that 2.618. this is how I normally calculate when to pull out and it blew me away that the final number came to the legendary $5.89 number.
XRPBULLUSDT trade ideas


Strong supportIf the support below not breached, then it will go up. if the support breached, then it will deep.

XRP/USDT: Preparing for the Next ImpulseMarkets move in cycles of Impulse ➡️ Correction ➡️ Impulse, and XRP is no exception. Since December 3, we’ve been in a correction phase, consolidating after the recent strong rally.
The structure is tightening, and the market is “cooking” something interesting. Watch for potential breakouts as we approach the next impulse phase.
📊 Let’s see how this unfolds—stay sharp and ready!
#CryptoAnalysis #XRP #TradingView

Wave 4There is no need to explain anymore. We are passing wave 4. It can move up to the yellow box and then launch to the moon.

XRP and what is actually happening Despite the widespread optimism and enthusiastic support for XRP on social media, the broader picture reveals a more nuanced and potentially precarious situation. Social media platforms often amplify sentiments that may not align with underlying market conditions, creating an echo chamber of bullish sentiment. This optimism can be misleading, especially when it fails to account for actual market dynamics like volume trends, liquidity constraints, or institutional participation.
A key factor complicating XRP's trajectory is the persistent selling pressure that offsets or even eclipses buying pressure. While social media narratives might suggest strong demand, on-chain data and order book analysis often reveal heavy selling activity. This dynamic suggests that market participants, including whales or early investors, could be offloading their holdings during price rallies, limiting upward momentum. Such consistent selling pressure acts as a ceiling for price appreciation and undermines the ability of XRP to achieve sustained breakouts. This indicates that the bullish consensus may be fragile, relying more on sentiment than market mechanics.
The potential for a short squeeze could further complicates the situation. However, selling pressure zeroing out buying pressure could indicate that short sellers have taken aggressive positions against XRP, expecting further price declines. However, this also creates a precarious balance. If buying pressure suddenly spikes due to a catalyst. While this might seem bullish, short squeezes are often temporary and highly volatile, leaving prices vulnerable to retracement once the squeeze subsides. It’s a double-edged sword that could momentarily align with the social media hype but fails to establish long-term stability.
Example in the H4 time frame based on XRP:USDT.P
Short explanation:
1) The main pane shows the price action. We can clearly see in the 4 hours time frame a majority of supply rather than a strong demand action (based on LL HL and retracement)
2) the choppiness level of the market seems to be quite persistent, indicating a clear consolidation path likely mid term lasting
3) the red line indicates the balance between premium and discount , and as we can see at present , the price is tapping constantly the discount area of support provided by the lower band of supply.
Some consideration about the BULL flag which I should call it BS flag most of the time when is so wide spread. Here the 4H chart for the current wide spread believe that XRP is creating a bull flag:
We can see clearly the choppiness of the market is even better visible adding the so called bullish triangle to the actual current price trend which will see some action between the new year eave and the 9th of January 2025:
In short, if you are an XRP holder spot just keep it , if you are trying to get the so called breakout be aware that market makers know how many retail traders are trying to jump into this high level of choppiness because over leverage is actually visible. Actually as an indicator when you have a good way to identify choppiness in the market , means that we should expect some sort of action soon the choppiness reached its peak. For this I wrote an indicator that you can see in my charts.
Price entries for buy :
Around 2.150 if does not break the demand zone below (always at least 3 candles confirmation in 3 different time frames)
If the demand zone is breached around that zone next one should be around 1.9500 and 1.90 . In between there are also several gaps to be covered so we could also expect a short squeeze and also an array of orders to sweep buy stop losses too.

$XRP - Short To Long Term Trade PossibilityBINANCE:XRPUSDT - This is how i reckon XRP play out. Short term target of $2.70-$2.80 for now from this particular area zone, followed by some pullback and then going head strong to break above $2.80. For now there can be a 30% profit probability. All the best

Xrpusd pattern breakoutXrpusd broke through resistance of the chart pattern on the 15min. 30pip stop loss with a 60pip take profit giving RR 2:1

Xrpusd pattern breakoutXrpusd broke through resistance of the chart pattern on the 15min. 30pip stop loss with a 60pip take profit giving RR 2:1

XRP 8X Leveraged Trade ExplainedWe are not there yet we our next leveraged trade for XRPUSDT. The truth is that one wave ended recently and there is always a period of rest between one wave and another. A trading range is established and the lower boundary tends to fail before the next wave. Let me explain.
If the support is set at $1.96, this support can hold as XRP consolidates (sideways). At one point, normally before the start of the next advance, there is a drop below support (support breaks). This drop tends to activate all the stop-loss orders and liquidate over-leveraged traders. After this event is complete, we see the development of a new bullish move.
The arrows on the chart are for illustration only. They depict several variations in which this scenario can develop.
The first impulse ended early December. Then comes the consolidation phase. A period of rest to consolidate all this growth the market experienced.
This consolidation phase can last between 1-3 months. We are thinking around three months based on the Mars retrograde, but this varies wildly between markets and pairs. So instead of focusing on a specific time we focus on the price.
The next advance can take XRPUSDT beyond $4.
We wait patiently, there is always a long rest period between a strong advance and the next leg-up. We are in that period now and XRPUSDT has been sideways for 23 days so far.
The red arrow better illustrates my point. Whenever the major drop is in, that's the signal to go LONG.
Before the drop is in, the market will continue to go sideways and this is when leveraged traders lose the most.
Ignore the SHORT side because the market is bullish.
Thanks a lot for your continued support.
Namaste.

Ripple is on the downslide againDuring the previous stages, Ripple experienced two ups and downs in Major Time.
The first time it took 399 days to ascend, and 427 days to descend, adding up to 826 days.
After that, due to the prolonged court proceedings of Ripple, its ascension time lasted 875 days. Considering the clarity of the issue and the outcome of the Ripple case, it is likely to go down to the level of 786, i.e. the price of $0.65, and it is normal for the SEC to fail to receive compensation , And otherwise, it will lead to a bigger fall.

Lingrid | XRPUSDT short-term Correction After a SKYWARD SurgeOver the past month, BINANCE:XRPUSDT soared to the $2.00 mark. Since then, the price has been fluctuating around this level. On the daily chart, it's moving sideways and forming a triangle pattern. While this pattern often signals a continuation of the trend, I think the price may dip below the key $2.00 level to take liquidity. This could create a good buying opportunity for bulls after a healthy retracement. I anticipate the market will form a "fakey" pattern, which typically involves a false breakout of the triangle. My goal is support zone around 1.9690
Traders, if you liked this idea or if you have your own opinion about it, write in the comments. I will be glad 👩💻

Bullish Descending TriangleHi there,
The price has formed a bullish-pennant on the 1-D timeframe as-well as what appears to be a bullish descending triangle. If it manages to breakout we could be looking at $3.8 heading into the New Years. The Stoch RSI has crossed on the 1-D timeframe and the RSI is also heading in that same direction which would then signal a golden cross which could signal a bullish movement. At current time of posting this the RSI sits at 54.84 to 58.79, it's coming close to forming that golden cross. Lower timeframes are looking healthy. Consolidation is essential.
The apex of the bullish descending triangle would coincidentally be around New Years Eve. The apex for the pennant is also coincidentally on the 21st January; Donald Trumps Inauguration. It seems as if it was written in the stars. Who knows what could happen and who knows, I could be awfully wrong.
With the SEC chairman being replaced and the possibility of the lawsuit being dropped XRPs future is bright and filled with ups and downs, but I will be there all the way along the journey.
Not financial advice.
Thank you for taking the time to look at my idea :)


XRP/USDT25-12-2024 G-Money's short version technical analysisXRP/USDT 2H G-Money's short version analysis based purely on technical analysis only, no nonsense or "BS". I do totally ignore any fundamental analysis, technical analysis only
XRP/USDT still kinda on the watchlist waiting for a signal to enter trade. Some early/partial entries are done as well already. Still waiting for crossing & closing candle over "entry" level...
What do you think?
Chart is itself explaining. Kept a "KISS" approach all the way ( "Keep It Simple, Stupid") & beginners friendly... ;)
I do hope that nobody ignoring SL ( Stop Loss) ! Without it, It is a fastest way to loose hard earned money...
;)
Trade safe & don't do "gambling". In the end it never pays, not worth it to risk loose all your $...
PS: above technical analysis is done for the community & educational purpose only! It is not a financial advice. Just share my very own insight to it.
This Technical analysis is my Christmas "Present" for You ! Merry Christmas to ALL !

long idea on XRPThis is a strange deal because I got it purely for myself, but for the sake of history and statistics, I’ll show it to the community. I just believe in its growth—why not?

Here is another entry for XRP This is another entry with a stop loss @ the 100% fib retracement. i am still in the trade just before this idea but for those who wish to add to a position or jump in for the 1st time this will be the time

XRPXRP - upside Target is 3.00
That is 1st one and very reliable.
BUT(1) it should be (sooner or later) much higher!

XRP Poised for Sideways Ahead of Potential Breakout (XRPUSDT)XRP seems likely to move sideways for another couple of months, forming a handle following the completion of a cup pattern. The appropriate point for the next significant move could be around the 50% Fibonacci retracement zone. Notably, XRP has already broken out on the monthly chart, adding further strength to its bullish potential.

XRP LONG SET UP RIPPLETitle: XRP/USD RIPPLE
Asset: Crypto
Symbol: BTC/USD
Order Type: Buy
Time Frame: 1D
Platform: Coinbase or MT4
Entry Price 1: $2.20
Entry Price 2: $2.00
Stop Loss: $1.80
Take Profit 1: $2.50
Take Profit 2: $2.90
Take Profit 3: $3.40
Take Profit 4: $3.80
Status: ACTIVE

XRP Long Flag pattern complete with new support post breakout just above 50% fib level.
1 hr time frame inverse head and shoulders pattern at breakout retest.
Expected next targets for XRP price is 3.1 USD area, 3.8 USD area.

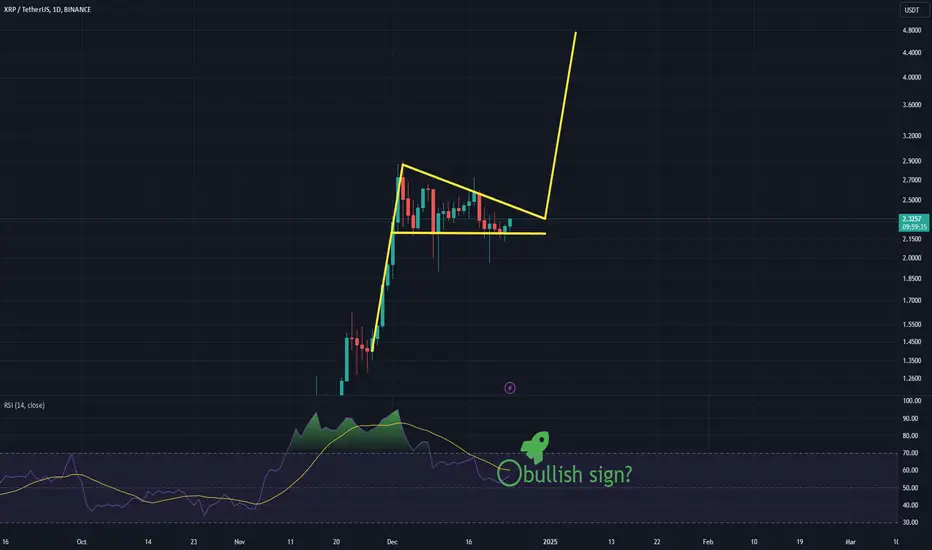
XRP Mid Term analysisRipple has formed a Bullish pennant. which means there should be a bullish movement pretty soon.
We can get a bullish sign from RSI as well which is pretty Good for maintaining the bullish Idea!
but no break out means no confirmation! we shall wait and see.
XRP Price TargetsAs we can see XRP is following its own previous fractal.
My price target is $5.5 till Jan 8, 2025
Multiple buying opportunities around $2.25
