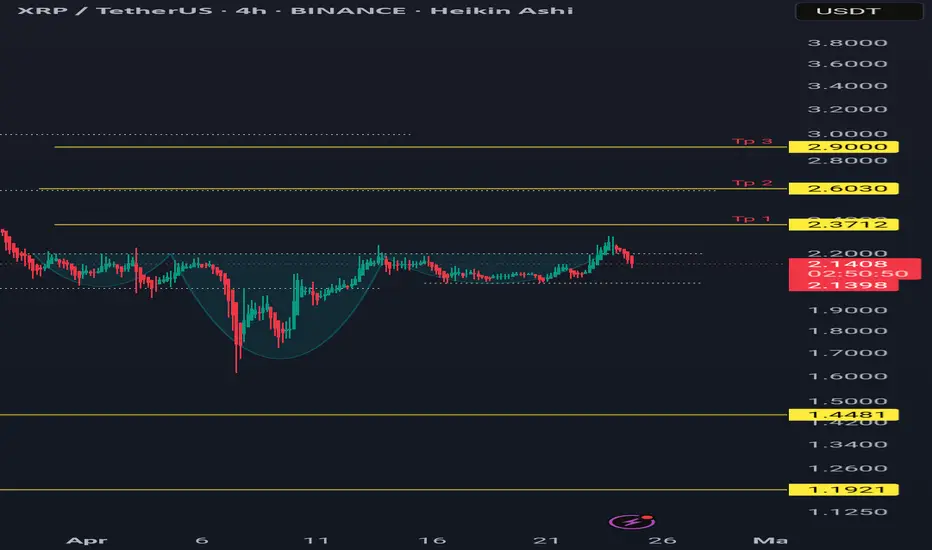
Xrpusdt formed a ihead and shoulder patternXrpusdt formed a ihead and shoulder pattern
Buy area
2.2-2.05
Targets are 2.37 tp 20%
2.6 tp 50% then move to breakeven
2.9 100%
Invalidation bellow the right shoulder
2.02
XRPBULLUSDT trade ideas
XRP?
Hi,
Intraday idea:
Yest made high 2.25-2.28 range
Today @ discount 2.17 about 10c
If we think; there will be a stronghand coming
we'll be buying range.. slowly.
All the best.
May you always success

XRP LOOKS GOOD.As of now the BTC is healing it self so we are looking some bullish volume in market which is good for market... So i noticed a bullish panent in XRP...

XRP Struggles at ResistanceXRP Struggles at Resistance
XRP touched the upper band of the falling channel and received the first rejection here. It was rejected from the same area before (red circles).
🔹 The price is now around $2.21 and very close to the resistance of the falling trend.
🔹 The RSI side is trying to stay above the 60 level. This means that the momentum is still positive, but it is also close to the overshooting zone.
🔹 The range of $1.96 - $2.00 is now critical support. If it is broken, there may be a possibility of retracement to the $1.50s again.
🔹 For the continuation of the rise, it is imperative to throw this red falling trend with a net close. Otherwise, the possibility of rejection from this area and return to the horizontal band increases.
The blue horizontal line is important; If the daily closing candle comes on it, it will break the downtrend. This is also the ceiling zone of the falling trend channel.
If the breakout comes, a rapid rally begins, otherwise a correction is on the agenda again.

$XRP Breakout alert XRP breakout alert!
Price flipped key support and holds above the 30 EMA on the 12h chart.
A move toward the mid-channel resistance around $2.76 is on the table.
Entry: CMP
Target: $2.76
SL: Below $2.10
Bullish setup brewing 🔥...DYRO NFA

XRP | Long | Breakout From Parallel Channel | (April 2025)XRP | Long | Liquidity Flip & Breakout From Parallel Channel | (April 2025)
1️⃣ Short Insight Summary:
XRP — often called "the chosen one" by some for its potential role in future financial systems — is showing signs of a breakout after a long period of decline. Liquidity inflows and a channel breakout point to possible upside ahead.
2️⃣ Trade Parameters:
Bias: Long
Entry: Around current breakout zone (~$0.91–$0.95)
Stop Loss / Invalidation: Below $0.88–$0.89 zone
TP1: $2.30
TP2: $2.50
TP3: $3.00
Final Target: $5.00+ (longer-term target)
✅ This setup includes partial profit-taking along the way, while holding a portion for potential extended moves.
3️⃣ Key Notes:
🔹 Fundamentals & Sentiment: XRP continues to attract speculation as a possible backbone for future digital financial systems, standing alongside Ethereum, Solana, and Cardano. Fundamentally, it's stable — though the broader crypto market sentiment (especially Bitcoin and dominance levels) needs to align for a major move.
🔹 Technical Setup:
XRP is breaking out of a long-standing parallel channel to the upside. Recent liquidations of over-leveraged short positions have brought fresh liquidity into the market — a classic signal that a reversal may be forming. With "money magnet" levels like $2.30 ahead, the path toward higher targets looks increasingly possible.
🔹 Market Context:
To sustain this move, we want to see Bitcoin dominance drop and Altcoin dominance rise — that would fuel capital rotation into assets like XRP. Watch those charts closely as this unfolds.
4️⃣ Follow-up Note:
I’ll monitor structure around each key level and may post updates if momentum strengthens or invalidation triggers. As always — position sizing and risk management are essential.
Please LIKE 👍, FOLLOW ✅, SHARE 🙌 and COMMENT ✍ if you enjoy this idea! Also share your ideas and charts in the comments section below! This is best way to keep it relevant, support us, keep the content here free and allow the idea to reach as many people as possible.
Disclaimer: This is not a financial advise. Always conduct your own research. This content may include enhancements made using AI.
Xrp idea Xrp seems to be stucked in this head and shoulders top pattern.
Probably head and shoulders top failure?
We will find out in due time.

XRP May Collapse During This CycleXRP has a giant head and shoulders formation in daily chart.
If it breaks 2$ level support zone, XRP may lose at least -%30 of it's value.
You can use it for short.
Safe entry would be below 2$ with a closeure of daily candle.
Or.. Simply short right from here but it would be risky.

XRP: Fresh Gains Ahead? Bullish Setup Intensifies.XRP Price Poised for Potential Breakout? Bulls Eye Fresh Gains Amid Bullish Setup as Open Interest Surges
The cryptocurrency market is a relentless arena of volatility, sentiment shifts, and technical battles. Among the major digital assets, XRP, the native token of the XRP Ledger, often finds itself at the center of intense debate and speculation, largely due to its unique position, technological proposition, and the long-standing regulatory shadow cast by the Ripple vs. SEC lawsuit in the United States. Recently, however, a confluence of factors has ignited discussions about XRP's potential for a significant upward move. With the price consolidating and holding firm above the psychologically crucial $2 mark, coupled with a notable surge in derivatives' open interest, bullish traders are keenly watching for signs that XRP might be coiling up for its next major run.
The Significance of the $2 Threshold: A Psychological and Technical Battleground
Price levels ending in round numbers often act as powerful psychological magnets in financial markets, and $2 is no exception for XRP. Crossing and holding above such a level can signal a significant shift in market sentiment, transforming previous resistance into potential support. For XRP, reclaiming and maintaining ground above $2 carries several implications:
1. Psychological Boost: A sustained presence above $2 instills confidence among existing holders and can attract new buyers who perceive it as a validation of strength. It breaks a mental barrier that may have previously deterred accumulation.
2. Technical Support: Historically significant price levels often become areas where buying interest clusters. If XRP consistently finds buyers stepping in around the $2 mark, it establishes this zone as a credible technical support level. A strong support base is crucial for launching further upside attempts, as it provides a foundation from which bulls can stage rallies.
3. Confirmation of Strength: In technical analysis, breaking above a major resistance level (which $2 may have been previously) and then successfully defending it as support (a "resistance-support flip") is considered a strong bullish signal. It suggests that the underlying demand is robust enough to absorb selling pressure at that level.
The current price action, characterized by XRP holding above $2 despite broader market fluctuations, is therefore a key factor fueling bullish optimism. It suggests resilience and a potential accumulation phase where buyers are absorbing supply, potentially setting the stage for the next leg higher. However, a decisive break below this level could conversely signal weakness and potentially trigger further downside.
Decoding the Bullish Technical Setup: Chart Patterns and Indicators Aligning?
Beyond the $2 level itself, chart patterns and technical indicators are providing further clues that bulls are closely monitoring. While specific patterns evolve rapidly, several common bullish setups could be in play or forming:
1. Consolidation Patterns: Often, before a significant price move (either up or down), an asset enters a period of consolidation. This can take the form of patterns like:
o Ascending Triangles: Characterized by a horizontal resistance line and a rising trendline of support (higher lows). A breakout above the horizontal resistance is typically considered a bullish continuation signal.
o Bull Flags or Pennants: These are short-term continuation patterns that form after a sharp price increase (the "flagpole"). They represent a brief pause before the trend potentially resumes. A breakout above the flag/pennant's upper boundary signals a likely continuation of the prior uptrend.
o Range Consolidation: Price trading sideways between defined support and resistance levels. A decisive break above the range resistance, especially on high volume, can signal the start of a new uptrend.
2. Moving Averages: Key moving averages (MAs) like the 50-day and 200-day simple moving averages (SMAs) are widely watched indicators of medium and long-term trends.
o Golden Cross: A bullish signal occurs when the shorter-term MA (e.g., 50-day SMA) crosses above the longer-term MA (e.g., 200-day SMA). This indicates that short-term momentum is strengthening relative to the long-term trend.
o Price Above Key MAs: XRP trading consistently above both the 50-day and 200-day MAs is generally viewed as a sign of a healthy uptrend. These MAs can also act as dynamic support levels during pullbacks.
3. Momentum Indicators:
o Relative Strength Index (RSI): This indicator measures the speed and change of price movements. An RSI reading above 50 suggests that bullish momentum is dominant, while readings above 70 indicate potentially overbought conditions (though an asset can remain overbought during strong uptrends). A sustained RSI above 50, possibly bouncing off this level during dips, supports a bullish outlook.
o Moving Average Convergence Divergence (MACD): This trend-following momentum indicator shows the relationship between two exponential moving averages (EMAs). A bullish signal occurs when the MACD line crosses above the signal line, especially if this happens above the zero line.
o
If multiple technical indicators and patterns align – for instance, XRP holding above $2, breaking out of a consolidation pattern, trading above key MAs, and showing strong momentum on the RSI and MACD – the case for a potential run becomes significantly stronger.
Open Interest Surges: Fueling the Fire or Adding Risk?
A particularly noteworthy development often accompanying potential price breakouts is a surge in Open Interest (OI) in the derivatives market (futures and perpetual swaps). Open Interest represents the total number of outstanding derivative contracts that have not been settled. It essentially measures the total amount of capital committed to that market.
• Rising OI + Rising Price: This is generally considered a bullish sign. It suggests that new money is flowing into the market, primarily opening long positions, reflecting increasing conviction among buyers that the price will continue to rise. The new longs add buying pressure and fuel the uptrend.
• Rising OI + Falling Price: This is typically bearish, indicating new money is entering to open short positions, betting on further price declines.
• Falling OI + Rising Price: This might suggest that the rally is driven by short-covering (short sellers buying back to close their positions) rather than new buying interest, potentially making the rally less sustainable.
• Falling OI + Falling Price: This often indicates that traders are losing conviction and closing out existing long positions, potentially signaling the end of a downtrend but not necessarily the start of an uptrend.
The reported surge in XRP's Open Interest while the price holds above $2 aligns with the bullish interpretation (Rising OI + Stable/Rising Price). It implies that traders are increasingly betting on upside continuation, adding capital to back their bullish theses.
However, high Open Interest also introduces risks. A large number of leveraged long positions makes the market vulnerable to a "long squeeze." If the price unexpectedly drops (perhaps due to negative news or a broader market downturn), it can trigger cascading liquidations of these leveraged longs. This forced selling adds intense downward pressure, potentially leading to a sharp price crash. Therefore, while rising OI can confirm bullish sentiment, it also amplifies potential volatility in both directions.
Fundamental Factors: The Ever-Present Shadow of the SEC Lawsuit and XRPL Developments
No analysis of XRP is complete without considering the fundamental factors, dominated by the ongoing legal battle between Ripple Labs and the U.S. Securities and Exchange Commission (SEC). The lawsuit, initiated in December 2020, alleges that Ripple conducted an unregistered securities offering through its sales of XRP.
• The SEC Lawsuit: This remains the single most significant factor influencing XRP's price potential, particularly concerning US-based investors and exchanges.
o Positive Outcome/Settlement: A favorable ruling for Ripple, a clear settlement defining XRP as not being a security, or favorable legislation clarifying the status of digital assets could remove a massive cloud of uncertainty. This would likely lead to relistings on US exchanges and potentially trigger a substantial price rally, potentially decoupling XRP somewhat from the broader market trend.
o Negative Outcome: A ruling deeming XRP a security could have severe negative consequences, potentially limiting its utility, hindering adoption (especially in the US), and causing a significant price decline.
o Ongoing Uncertainty: As long as the case drags on, it acts as a headwind, potentially suppressing XRP's price relative to other cryptocurrencies that don't face similar regulatory challenges. Positive developments or perceived wins for Ripple during the legal proceedings often cause short-term price spikes.
• XRP Ledger (XRPL) Developments and Adoption: Beyond the lawsuit, the underlying technology and its adoption matter.
o On-Demand Liquidity (ODL): Ripple's primary use case for XRP, facilitating low-cost, instant cross-border payments, continues to see adoption, primarily outside the US. Growth in ODL volume signifies real-world utility.
o Central Bank Digital Currencies (CBDCs): Ripple is actively engaging with central banks globally, exploring how the XRPL could potentially support CBDC initiatives. Success in this area could significantly boost the ledger's profile and potentially XRP's utility.
o Other Use Cases: Developments around NFTs, decentralized finance (DeFi), and smart contracts on the XRPL, while perhaps less mature than on other blockchains, contribute to the ecosystem's overall value proposition.
Will Buyers Push XRP Further? Potential Targets and Risks
Given the confluence of factors – holding the $2 support, potentially bullish technical setups, and rising open interest – the question remains: can buyers sustain the momentum and push XRP significantly higher?
• Potential Upside Targets: If the bullish scenario plays out and XRP breaks decisively upwards, potential resistance levels and targets could include:
o Recent swing highs (e.g., $2.20, $2.50, depending on recent price action).
o Psychologically important levels ($2.50, $3.00).
o Fibonacci extension levels based on previous price swings.
o The previous all-time high (around $3.40 - $3.84 depending on the exchange data).
• Key Risks: Despite the bullish signals, significant risks persist:
o SEC Lawsuit: Any negative news or ruling remains the primary threat.
o Market-Wide Correction: A downturn in Bitcoin or the broader crypto market could easily drag XRP down, regardless of its individual setup.
o Failure at Resistance: If XRP attempts to rally but fails to break through key overhead resistance levels, it could lead to a reversal.
o Breakdown Below Support: A decisive drop below the $2 support level would invalidate the immediate bullish thesis and could open the door to lower targets (e.g., $1.80, $1.50, or key moving averages).
o OI Liquidation Cascade: As mentioned, high open interest could fuel a sharp sell-off if sentiment sours.
Conclusion: Cautious Optimism Warranted
The current situation for XRP presents a compelling, albeit complex, picture. The ability to hold the crucial $2 support level is a significant show of resilience. Combined with potentially forming bullish technical patterns and a notable surge in open interest suggesting fresh capital inflow and conviction, the ingredients for a potential price run appear to be gathering. Bulls are rightly eyeing fresh gains, encouraged by these developments.
However, caution remains paramount. The cryptocurrency market is inherently volatile, and XRP carries the unique and substantial burden of the SEC lawsuit's uncertainty. While technicals and derivatives data might point towards bullish potential in the near term, fundamental risks and the ever-present possibility of market-wide corrections cannot be ignored. A breakdown below $2 support or negative news from the legal front could quickly invalidate the bullish outlook.
Traders and investors considering XRP must weigh the potentially explosive upside against these considerable risks. Monitoring the $2 level, key resistance zones, developments in the SEC case, and overall market sentiment will be crucial in navigating XRP's next potential move. While the setup looks promising for the bulls, confirmation through decisive price action and continued positive momentum is needed before declaring that XRP is definitively "ready to run."
Disclaimer: This article is for informational purposes only and should not be considered financial advice. Trading cryptocurrencies involves significant risk, and you could lose your entire investment. Always conduct your own thorough research and consult with a qualified financial advisor before making any investment decisions.

xrp in deepWhat I saw on the Ripple chart is not worth mentioning. I see a very big target for it, and I think the momentum of this currency will grow significantly.
XRP BUY/LONG SETUPHello, TradingView community and my subscribers, please if you like ideas do not forget to support them with your likes and comments, thank you so much and we will start a BUY/LONG outlook on #XRPUSDT.P explained


XRP Ripple Is Showing That Correction In Crypto Is OverHello, Skyrexians!
Let's continue to look at the different confirmations of the incoming growth on crypto. BINANCE:XRPUSDT is one the largest altsoins was in correction for 4 month. This was a global wave 4, now we have the confirmation that Ripple coin will reach new ATH.
Let's take a look at the daily time frame. Previous huge impulse consists of 5 waves. It was a global wave 3, now we are in the ABC shaped wave 4. The anticipated wave C has been finished inside the 0.61 Fibonacci Retracement. Also we can see the bullish divergence and increasing momentum at the Awesome Oscillator. Moreover, we can see the green dot on the Bullish/Bearish Reversal Bar Indicator , which is the great potential growth confirmation. The target for the next wave is approximately at $3.8, but can be recalculated further.
Best regards,
Skyrexio Team
___________________________________________________________
Please, boost this article and subscribe our page if you like analysis!

XRPUSDT?
Hi ,
2.000000000 is good round number to break.
If trading below 1.80 I don't like it.
Hope it gives some idea. How the flows.. and what to look at. my target is 4.000.. the rest will manage as it goes.
Will take this risk.
1:1 only.
Manage wisely.
All the best

Bearish Continuation or Reversal? XRP at Make-or-Break ZoneCurrent Price: around 1.956 USDT (bouncing slightly as of now).
Support Zone:
First Support: 1.821 USDT
Stronger Demand Zone (highlighted in the blue box): 1.6215 to ~1.84 USDT
Price might test this zone if the downward momentum continues.
Could serve as a potential buy zone or accumulation area.
- Watch for a breakout from the channel with strong volume for confirmation of a reversal.
- A breakdown below the support box would invalidate the bullish outlook and could signal deeper downside.

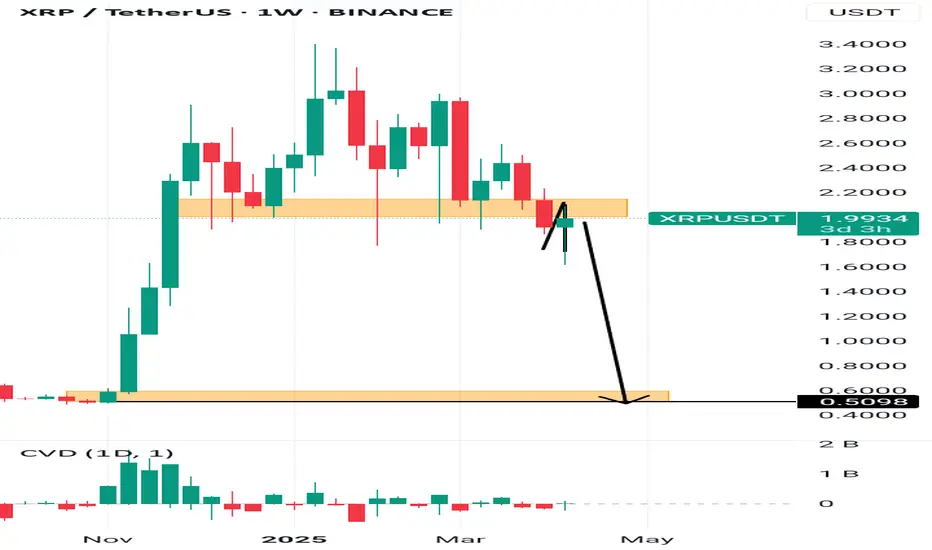
Bearish MovementXrp has a structure of a head and shoulders(H&S), with the second leg developing after breakout and retest.
Meaning it will drop all the way to 0.5098
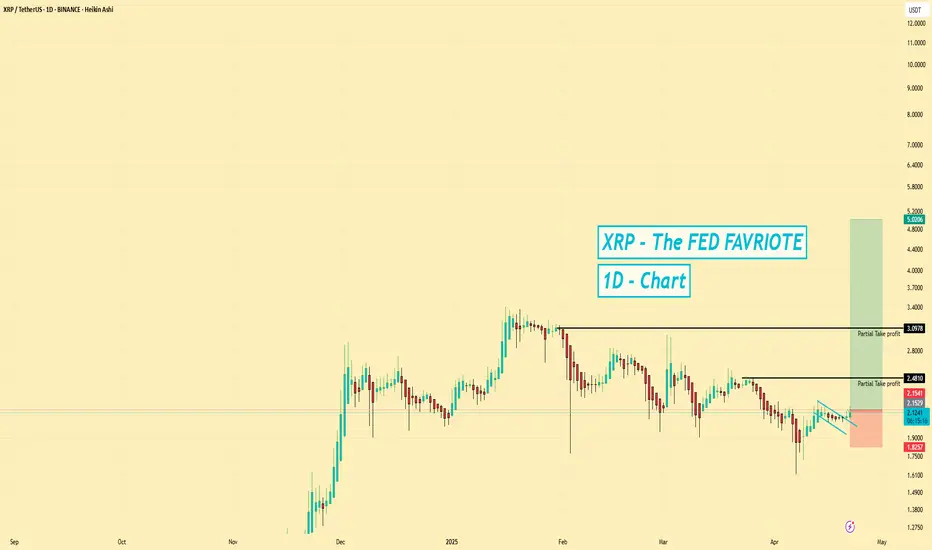
XRP/USDT DTF Chart – Technical & Fundamental AnalysisXRP/USDT DTF Chart – Technical & Fundamental Analysis
On the DTF chart, XRP is currently in a prolonged consolidation phase, largely due to uncertainty in the financial markets. As we analyze this further, we've identified several key levels that will be crucial for our next market price movement, particularly in alignment with any breakouts that occur at these levels.
We have identified two minor key resistance levels at 2.2500 and 2.5000, which are important to watch. However, the major level we’re eyeing for a potential breakout is 1.9000, our primary support level. This support has already broken clearly, triggering a large volume of sellers’ pending orders. However, market makers stepped in and pushed the price back up, hunting for liquidity. Currently, the price is within this liquidity zone.
We expect a clear liquidity buildup within this zone before the price breaks below the major support again. If that happens, we will position a sell stop order at 1.8900, with a stop-loss at 2.2320 (just above the liquidity zone in case of further liquidity buildup). The take-profit (TP) target is set at 0.9430, the next major key support level.
Technical Outlook:
Key Resistance Levels: 2.2500 and 2.5000
Key Support Level: 1.9000 (already broken, triggering selling pressure)
Liquidity Zone: Current price is within a liquidity zone, anticipating further price action.
Sell Stop Order: 1.8900
Stop-Loss: 2.2320 (above liquidity zone)
Take-Profit: 0.9430 (next major support)
However, this analysis provides a key technical outlook on the setup, while it's also important to consider the positive news surrounding XRP. Ripple's acquisition of Hidden Road and the launch of the Teucrium XRP ETF could act as significant catalysts for XRP’s price. These developments highlight Ripple's commitment to expanding its presence in the growing decentralized finance (DeFi) sector, which could drive future demand for XRP. This is why we are also monitoring the two minor key resistance levels for potential breakouts. If we see breakouts at these levels, it could signal a positive and bullish move for XRP in the future.
On the other hand, the ongoing tensions between China and the U.S. remain a critical factor to watch, as both countries hold substantial Bitcoin reserves, which could influence broader market sentiment. A resolution of these trade disputes could alleviate some market pressures and contribute to a bearish outlook for XRP, especially if the market views these developments as stabilizing factors for global trade. Additionally, it's important to note that the market could face a global recession before the current uncertainties are resolved.
📌 Disclaimer:
This analysis is for informational and educational purposes only and should not be considered financial advice. Trading involves substantial risk, and past performance is not indicative of future results. Always conduct your own research and consult with a financial professional before making any investment decisions.

XRP/USDT – LONG Setup
Price is moving within a descending channel and currently testing the bottom trendline, which has acted as a strong support historically.
A rounded bottom pattern is forming inside the channel, suggesting a possible accumulation phase before breakout.
Break above $2.00–$2.20 resistance could signal the beginning of a bullish wave toward higher levels.
This structure mirrors classic reversal patterns within downtrend channels. If the bullish reaction holds at the lower boundary and a breakout occurs, XRP may gain significant momentum toward $3+.
🔹 Direction: LONG 📈
🔹 Entry Zone: $1.70 – $1.85
🔹 Stop Loss: Below $1.60
🎯 Targets
TP1: $2.3385
TP2: $2.8160
TP3: $3.3062

Lingrid | XRPUSDT Correction Following ABC move CompletionThe price perfectly fulfilled my previous idea . It reached the target. BINANCE:XRPUSDT price has completed its ABC move, which is typically followed by the pullback we're currently witnessing. The market has broken below the psychological 2.00 level and its established range zone. I think the price may move toward the middle of the range zone, as this area historically acts as both support and resistance. However, considering the downward trendline and the key resistance at 2.00 above, I anticipate the price may rebound from that zone and continue its downward trend. My goal is support zone around 1.60
Traders, if you liked this idea or if you have your own opinion about it, write in the comments. I will be glad 👩💻

Ripple Nearing Strong Support: 18% Upside to $1.99 TargetHello and greetings to all the crypto enthusiasts, ✌
All previous targets were nailed ✅! Now, let’s dive into a full analysis of the upcoming price potential for Ripple 🔍📈.
Ripple is currently approaching the lower boundary of a descending channel, with a robust monthly support level in close proximity. Given this, I anticipate at least an 18% upside from this point, with a target of $1.99, a critical resistance level and a psychologically significant round number. This presents a promising opportunity for short-term growth while navigating key technical levels.📚🙌
🧨 Our team's main opinion is: 🧨
Ripple is approaching strong support in a descending channel, with a potential 18% gain and a target of $1.99, a key resistance level.📚🎇
Give me some energy !!
✨We invest hours crafting valuable ideas, and your support means everything—feel free to ask questions in the comments! 😊💬
Cheers, Mad Whale. 🐋

XRP ... silence before the storm !Hello Traders 🐺
I hope you're doing well — especially during the current market conditions.
Honestly, these days everything seems to be bearish, and staying positive and motivated through the losses is a bit hard, even for pro traders.
But as they say:
If you can't hold during the crash, you probably won't hold during the boom.
Or like the old man said:
"Those who survive the dump, deserve the pump!"
Let’s talk about XRP 👇
As you can see on the chart, price is clearly inside an ascending channel, which can also be considered a bull flag — because when we see a correction after a strong rally, it’s healthy for the market.
In such cases, price tends to form a pattern, and most of the time it's either a channel or some kind of wedge.
In this case, we have an ascending channel — or as mentioned, a bull flag.
So what can we do now?
There are two important trendlines to watch:
The blue line (monthly resistance)
The yellow line (channel support & resistance)
Right now, price is sitting below the blue trendline, so we’ll need a monthly close above it to confirm breakout — it's too early to judge just yet.
If we break in either direction, we have key Fibonacci levels to keep in mind:
0.618 and 0.718 fib levels are acting as support for now — and if we break to the upside, the upper channel resistance is the next big level to watch.
In my opinion, despite BTC.D's current position, there’s a strong chance we’ll see a reversal in the Altcoin sector and a major drop in BTC.D.
If you haven’t read my recent idea about BTC.D yet (which is going viral and was even chosen as an Editor’s Pick), I strongly suggest checking it out here 👇
It’s super important to combine macro fundamentals with technical analysis — and when it comes to Altcoins, BTC.D is a key index you should always pay attention to.
I hope you find this information valuable — and as always, remember:
🐺 Discipline is rarely enjoyable, but almost always profitable
🐺 KIU_COIN 🐺

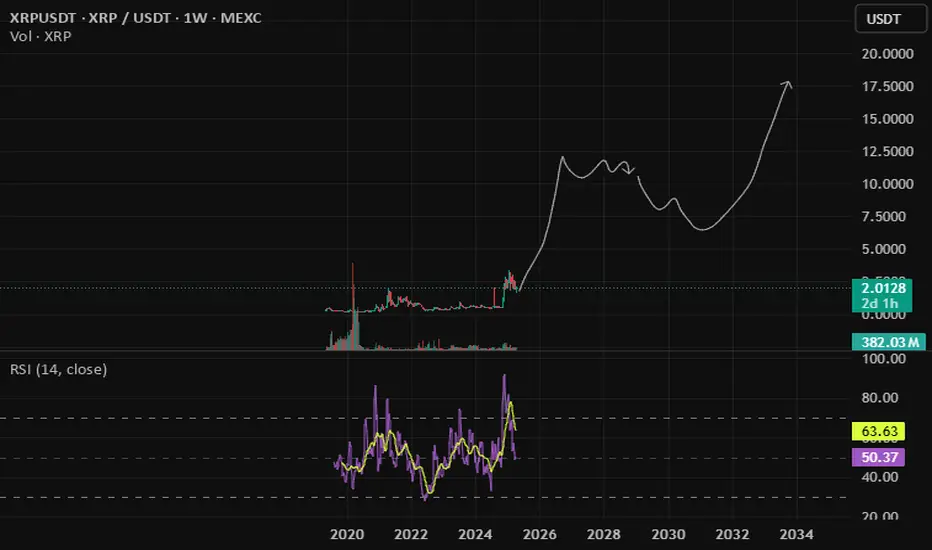
#XRPUSDT: Bullish Reversal Coming With Price Heading Back To 3.5## XRPUSDT Analysis: Long-Term Perspective
In the long term, we anticipate the XRPUSDT price to revert to its all-time high of 3.5. From a fundamental analysis standpoint, we maintain a positive outlook, with the potential for the price to surpass 3.5. We have identified a favourable trading opportunity, as illustrated in the chart.
Our approach is neutral, as the trend remains undecided. Based on the duration of your positions, you can set two targets:
1. **Short-Term Target:** If you intend to hold your positions for a short period, aim for a price level above 3.5.
2. **Long-Term Target:** For long-term investors, a target price of 4.0 or higher is plausible.
We are committed to providing comprehensive analysis and support. Should you have any inquiries or require further clarification, please do not hesitate to contact us.
Additionally, we would appreciate your insights on which cryptocurrency pair you would like to explore next.
Regards,
Team Setupsfx_

#XRP USDTEvery high is an opportunity to get out, don't miss the opportunity to buy at low prices
Don't rush to buy, soon the prices of all coins will return to where they started.
Do not trade futures in this market, only spot.
Please check all my previous analyses, all of them came true
