XRP range - price sitting on supportXRP seems to have established a range here with price now close to the bottom of the range.
Also possible ascending channel with price reacting to bottom of channel.
Also seeing these possible flags/descending channels with price consolidating downwards with a good possibility for a reaction around these confluences.
Invalidation is below the lower support for the range with maybe a little room in case of deviation.
XRPBULLUSDT trade ideas
Long Position XRP/USDT🚨 XRP/USDT – Intraday Outlook (15-min Chart)
After reacting strongly to the mid-term support at 1.630, XRP has been climbing steadily and is now testing short-term trendline support to break it down to 1.8153.
🔹 Current Price: 1.93
🔹 Support Zone to Watch: 1.8153 – 1.7083 (Possible Long Zone)
🔹 Upside Target: 2.15+
📉 A short-term pullback toward the Possible Long Zone could offer a high-probability long setup. If bulls step in around that level, we might see a trend continuation toward the 2.15 or even higher regions, signaling a potential bullish reversal on the mid-term.
📊 With the overall recovery trend still holding, traders should watch for a break-retest setup or a bullish confirmation in the demand zone.
🧠 Smart Play: Patience is key. Let the price come to your level and watch for confluence.
What do you think? Is XRP ready to reverse for good?
XRPUSDT → The bulls won't hold support. Falling to 1.9BINANCE:XRPUSDT is under pressure despite quite positive news. The coin, being in a downtrend, continues to test the key support. The chance of a breakdown is growing
XRP continues to test a strong support zone on the weekly timeframe, relative to this zone, in the medium term, two scenarios can develop, which depend on the general mood in the market. If the current backdrop persists, the chance of a downside breakdown and further decline is quite high.
At the moment, the focus is on the key support at 2.0637, relative to which the retests continue, and the reaction is getting weaker and weaker, which in general only increases the chances of a further fall to 1.9 - 1.63.
Resistance levels: 2.265, 2.365, 2.509
Support levels: 2.0637, 1.9
The cryptocurrency market is going through bad times (Tariff War, high inflation, stock market decline, disappointment of the crypto community due to expectations) and until the situation starts to change, the technical picture will remain negative. XRP may continue its fall after a small correction.
Regards R. Linda!
XRP at $1.9: Testing Key SupportXRP is currently trading at $1.9, a pivotal level, as the crypto market grapples with a 4.4% drop in the last 24 hours. Macro uncertainty, think US inflation data and Fed rate hike fears, is pressuring risk assets. Yet, XRP holds steady, buoyed by whispers of a Ripple partnership with a major European bank for cross-border payments and ETF speculation (unconfirmed).
Technical Analysis
Short-Term (Daily Chart):
Support: $1.90 (current), $1.80
Resistance: $2.00, $2.10
RSI sits at 48 (neutral), while MACD hints at bearish momentum. XRP’s testing the lower edge of a descending channel, holding $1.90 could trigger a bounce to $2.00, but a break below eyes $1.80.
Long-Term (Weekly Chart):
Support: $1.70, $1.50
Resistance: $2.50, $3.00
The 200-day MA is sloping down, signaling caution, but $1.70 is a solid base for bulls.
Potential Scenarios
Bullish: If $1.90 holds and $2.00 falls with strong volume, expect a push to $2.10 short-term, possibly $2.50 long-term if adoption news hits.
Bearish: A crack below $1.90 could test $1.80, with $1.70 next if selling ramps up.
Trading Tips and Context
XRP’s real-world use in payments and recent partnerships fuel long-term hope, but the SEC lawsuit looms as a risk. Short-term traders: trade the range between $1.90 support and $2.00 resistance, set stops tight (e.g., below $1.90 for longs). Long-term holders: $1.70 is your critical level. Keep an eye on SEC updates or ETF chatter for catalysts.
XRPUSDT Bearish ForecastHi there,
If the price breaks below the support area, there might be a bearish continuation down to two levels that make up the price targets for a bias of 1.2611.
The price is currently bullish above that support area in a strong downward momentum; it might be possible that it will play around that area, consolidate or do some fake-outs.
Happy Trading,
K.
Not a trading advice.
Ripple’s Triple Top Signals $2 Breakdown, Eyes $1.90 SupportHello and greetings to all the crypto enthusiasts, ✌
All previous targets were nailed ✅! Now, let’s dive into a full analysis of the upcoming price potential for Ripple 🔍📈.
Ripple has demonstrated a classic triple top formation, with each successive peak showing weaker momentum. As it nears a formidable resistance zone, a break below the $2 threshold appears imminent. This downward move is expected to extend to at least $1.90, reflecting a minimum decline of 18%. Such a drop aligns with the primary target and a key daily support level.📚🙌
🧨 Our team's main opinion is: 🧨
Ripple’s losing steam after three peaks, eyeing a drop below $2 to around $1.90, with an 18% plunge hitting a key support level. 📚🎇
Give me some energy !!
✨We invest hours crafting valuable ideas, and your support means everything—feel free to ask questions in the comments! 😊💬
Cheers, Mad Whale. 🐋
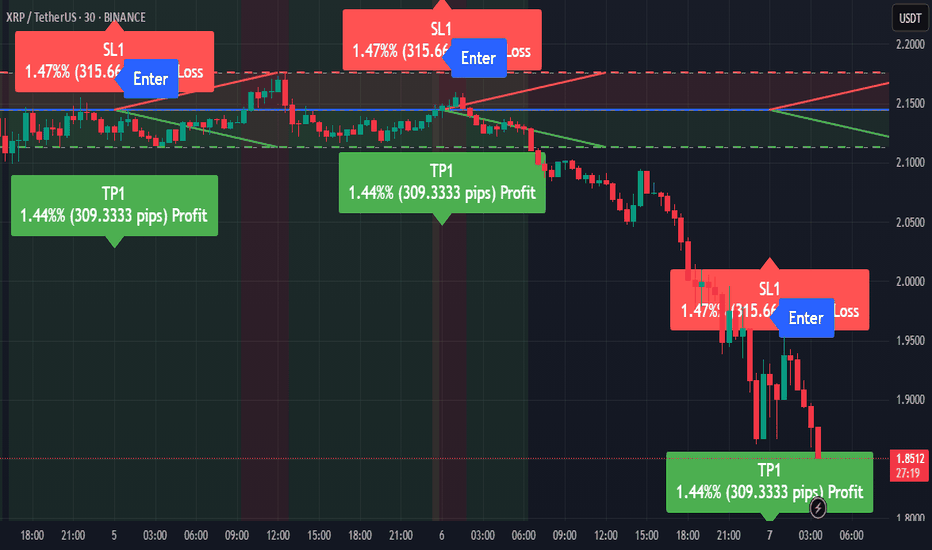
XRPUSDT Short Opportunity Highlighted by EASY Trading AI StrategAnalyzing XRPUSDT today using the EASY Trading AI model, I've identified a solid Sell signal. The AI indicates entering short at 2.1442, targeting a profit at 2.11326667, with a recommended Stop Loss at 2.17576667.This forecast emerges from specific patterns detected by the EASY Trading AI, showing weakened bullish momentum and increased seller activity. Continued bearish pressure aligns with technical resistance at current levels, supporting a downward move.Stay disciplined and adhere strictly to the entry, TP, and SL provided, ensuring robust risk management in your trades.
XRP back to $0.75 ??if the bounce will continue going up i am looking for a short position... all the way down to $0.75 and slightly lower. YES IT IS POSSIBLE!. on the weekly candles there is a huge FVG and also the projected move from the range where XRP now trades in is at $0.75
letst see what it does the coming weeks/months.
// LOW LEVERAGE \\ (max 5x)
short entry 2.275
stoploss 2.65
take profit 0.75
Rounded Top Forming – Will XRP Hold the $2 Support Line?CRYPTOCAP:XRP is currently showing signs of weakness as it continues to drift lower beneath a rounded distribution arc. The price action indicates a potential rounded top pattern, which typically suggests a gradual shift from bullish to bearish sentiment.
The asset has broken below the mid S/R zone and is now trading near a crucial strong support area, just above the 200 EMA — which is acting as dynamic support at around $1.95. This level is a key battleground for bulls and bears.
DYR, NFA
XRP XRP failed to break through the $2.1597 resistance and is now heading back toward the $2.0216–$1.9000 support zone.
If this support fails to hold, lower lows may be on the horizon.
A bullish reversal requires a breakout above resistance and confirmation above the 200 MA.
🎯 Next targets: $2.4729 and $2.59
📉 Weak volume and rejection from key levels increase bearish pressure.
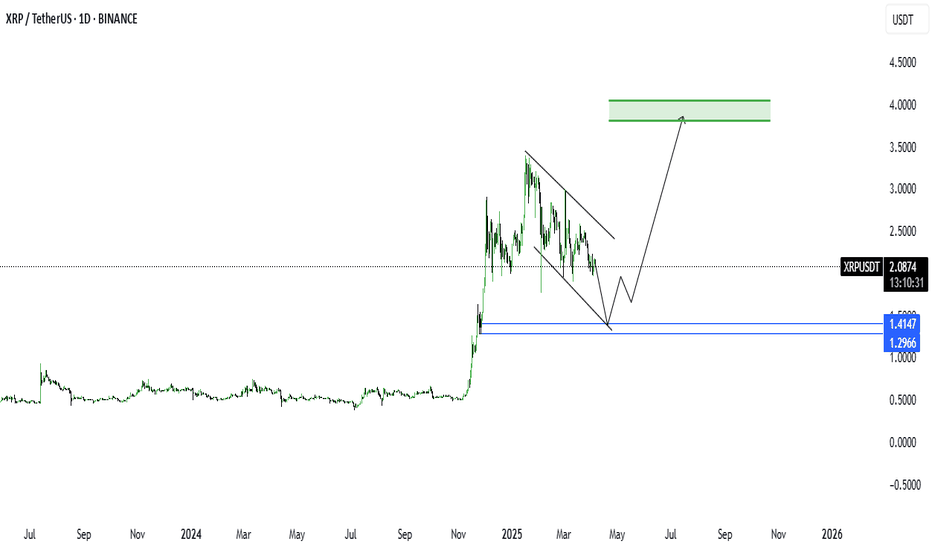
xrp update Here's a polished version of your message that you could use for a post or update:
---
**XRP Update:**
Currently trading around **$2.085**, we're anticipating a **pullback toward the $1.40** levels. That zone could offer a **great opportunity** for long-term investors and spot traders to enter.
🎯 **Targets:**
- First target: **$3**
- Second target: **$5**
**⚠️ Patience is key — wait for the opportunity. Don’t jump in too early.**
Good luck, everyone! 💰🚀
---
Want it styled as a tweet, YouTube caption, or short video script?
XRPUSDT Short Opportunity -6.58% TargetWe just bounced (convincingly) off the mean average price established over the last 10 days and we are currently accelerating further down as I write this. I am short this area, it has already moved into profit so I will trail this to it's conclusion.
I think there is a high degree of likelihood we retest the swing low of $1.95 based in the continuing trend on the 1D chart.
The more a support is tested, the weaker it becomes.This is my expectation for Ripple in the coming period.
* The purpose of my graphic drawings is purely educational.
* What i write here is not an investment advice. Please do your own research before investing in any asset.
* Never take my personal opinions as investment advice, you may lose your money.
XRPUSDT Chart Analysis (as of April 5, 2025)📉 General Trend:
This is a short-term chart (1H timeframe).
The market is moving sideways with high volatility – no clear trend, but a range-bound movement between support and resistance levels.
A directional breakout may be coming soon.
🔍 Support and Resistance Levels:
🔵 Support:
2.0472 USDT – Key support with BOS and Discount zone.
2.000 USDT – Strong Low + PM area below.
1.920–1.950 USDT – Historical demand zone.
🔴 Resistance:
2.2244 USDT – Equilibrium zone + PDH.
2.3556 USDT – Significant resistance with supply block.
2.4978 USDT – Upper resistance level.
2.7461 USDT – Strong resistance from previous highs.
3.00–3.20 USDT – Major Premium zone with PM and Weak High.
🎯 Short-Term Price Forecast (1–2 Days):
If a breakout to the upside occurs:
First target – 2.22 USDT, then 2.35 USDT.
If a breakdown occurs:
First target – 2.04 USDT, then 2.00 USDT.
📉 Short Trade Setup:
Entry: Around 2.22–2.23 USDT (PDH + resistance + potential BOS)
Take Profit: 2.05 USDT
Stop Loss: Above 2.25 USDT
Risk-to-Reward Ratio: ≈ 1:2
Trigger: Bearish rejection candle or BOS near resistance.
📈 Long Trade Setup:
Entry: Between 2.04 – 2.06 USDT (demand zone + lower BOS)
Take Profit: 2.22–2.24 USDT
Stop Loss: Below 2.00 USDT
Risk-to-Reward Ratio: ≈ 1:2.5
Trigger: Bullish hammer or confirmation candle with increasing volume.
🔻 Lowest Expected Price:
If 2.00 USDT breaks down, price could fall toward the 1.90–1.92 USDT zone.
🔁 Potential Reversal Zones:
High probability of reversal around 2.04–2.05 USDT, a key local low in a discount zone.
Another bullish reversal may form if the price breaks and holds above 2.24–2.25 USDT with confirmation.
🧠 Additional Notes:
The chart includes many Smart Money Concepts (SMC): BOS, CHoCH, EQH, etc.
There’s a clear battle between bulls and bears – we must wait for a confirmed breakout or breakdown.
Volume is balanced – not indicating a strong impulsive move yet.
$XRP Update🔸
XRP is trading according to our expectations and holding within the key support zone.
🔸 Support Zone: $2.22 - $1.92
🔸 Upside Target: $3.00 - $5.00+
🔸 Risk Level: Below $1.92
🔸 Action Plan:
✅ Entry: $2.22 - $1.92
✅ Confirmation: Above $2.50
✅ Stop Loss: Below $1.30
✅ Targets: $3.00, $4.00, $5.00+
🔸 If Price Breaks Below $1.92:
Watch for a new entry in the next accumulation zone between $1.60 - $1.30.
💡 Below $2 still looks like a gift!


