day three XRP price prediction date: 3/30/2025right now we are in a time of fud (fear uncertainty and doubt) and the price could bounce off of the 2.00 dollar mark or it could just break it though it is a strong support they could all fail at some point
XRPUSDC_69033B.USD trade ideas

XRP USDXRP/USD Short Position Update
Currently tracking a short setup on XRP/USD, with an entry at 2.17554, stop loss at 2.22573, and a target of 2.10437.
Market Structure: Price rejected a key resistance level, showing signs of exhaustion.
Bearish Confluence: Increased selling pressure with wicks forming at the highs, indicating potential downside continuation.
Risk Perspective: The trade aligns with the broader trend, respecting liquidity zones and key support levels.
Watching for a decisive move toward the TP, with risk management in place should momentum shift. Let’s see how price action unfolds.
#XRP #Crypto #Trading #PriceAction

The XRP Bull Run Starts Today (XRP to 3 Digits)XRP is following it's 2017 pattern very closely and it looks like it's about to turn around.
The resemblances between March 2017 and March 2025 are numerous. Should the 2017 pattern hold, we might expect XRP to reach double-digit levels in April, approach triple digits in late May or June, and peak in late 2025 or very early 2026.
Both macro and micro factors indicate that a significant bull run is around the corner.
P.S. I view the November surge as merely the release of regulatory pressure that had been suppressing XRP, allowing it to return to the level it might have achieved without such constraints.

XRP/USD TO $5.25 in two monthsXRP/USD potential break out from $3.30 might happen mid-April or early May it may lead to all time high of $5.25 per XRP

XRP bearish flightpathIn the event of a retracement the P.A. for XRP could react to the fibs
The 618 would present a nice bounce off the downtrend that has been in play since Jan 2007.
Breaks below this could result in a touch off the 786 which would also coincide with the uptrend that formed shortly before the "pump" in Nov 24
Believe a new ATH will be printed c. $11 toward the end of 2025.

PumpLoad up on the second april we shoot up to 5 dollars then sideways then may we shoot up to 10 dollars

XRP Bearish, Mid-March 2025 Shorts??With XRP having broke through its daily uptrend and now at its weekly resistance set by the lows of December 2024, its next point of interest will be ~$2.60 - $2.90.
Around the middle of March 2025, the downtrend formed by the January 2025 high would be converging with the December 2024 - February 2025 uptrend that was broken. Price has now broken below the 50 day and 100 day SMAs. With the 50 day SMA looking to cross at this convergence point at ~$2.70 and the 100 day SMA trailing the broken daily trendline to meet at ~$2.55, this could gear up for a wicked rejection that could move south fast.
With the bounce XRP has taken recently, it could look to retest its highs from March 2021 to November 2021. With the 50 WMA looking to target ~$1.50 in May 2025, this initial breakdown below the weekly resistance line set by the December 2024 - January 2025 could quickly find itself retesting the late November 2024 distribution, and the secondary breakdown could target the middle November 2024 distribution.
Entry: $2.70 - $3.00
Ideal Entry Average: $2.85
T1: $1.50
T2: $1.25

XRPUSD: The 5 year Channel Up is targeting 6.500XRP is neutral on its 1W technical outlook (RSI = 53.399, MACD = 0.310, ADX = 41.023) as since the Jan 13th High, the uptrend took a pause and turned into a sideways consolidation. As long as the 1W MA50 is intact, the Bull Cycle will be supported and since the dominant pattern is a 5 year Channel Up, we are on the latest bullish wave. As a matter of fact we have technically entered the last year of the bullish wave, which is so far identical to the March 2020 - April 2021 wave (also on RSI count). The market is currently (March 2025) on a consolidation much like March 2021. We estimate a similar +1,648% rise (TP = 6.500).
## If you like our free content follow our profile to get more daily ideas. ##
## Comments and likes are greatly appreciated. ##

0.93 Incoming If you look at the national weather report you will see it’s calling for 0.93 per XRP.
Money money money 💵


daily XRP price prediction day two Date:3/27/2025so today i have found a few more possible ways for xrp some bearish some bullish but the one with the most outcomes was xrp which would mostly end around the 2.90 to 3.00 dollar mark.
Get ready, XRP about to flyRejected block tapped, will we see $2.50 prices?
We previously mentioned that we wanted 50% of this area to give us support, however, 50% just ended up creating equal highs, we then traded all the way below its rejected ob. Will we now see price push higher past $2.50 highs?

260 days $24XPRUSD new ath coming in 2025. Referencing the timeline from 2017 to predict the BTC outcome in 2025. If i was to assume everything will playout similar this time around in terms of relative price action we should see $24 XRP by summer of 2025. It really all depends on how far alts fall in this coming crash. We are still very much in a bull market. 260 days till the party is over.

THOUGHTS ON XRP/USDXRP/USD 1D - As you can see price has been sat within this range for some time now, I think its only a matter of time before we have our next rally to the upside. I was sceptical about seeing price take a further down move to clear the inefficiency.
However price has shown good signs of holding within this range and its actually respecting these areas of Demand as you can see above, this tells me that the balance is in fact in favour of the Demand in the market.
I have gone ahead and marked out a fractal area here, I would like to see price clear the orders within this before that hike, this gives people the opportunity to top up on XRP should they want to.
From this next hike I am predicting price to surpass previous highs that have been set within this range, and I am expecting that the lows set here would then be seen as protected following the laws of Bullish structure.

xrp format rsi and macd"The XRP/USD pair is currently exhibiting signs that may indicate a potential bullish reversal.
Technical Analysis:
Relative Strength Index (RSI): The RSI is at 49.28, suggesting neutral momentum. A move above 50 could signal strengthening bullish momentum.
Moving Average Convergence Divergence (MACD): The MACD line is at -0.00453, positioned above the signal line at -0.01699. Despite both values being negative, this crossover may indicate a weakening bearish trend and a potential shift towards bullish momentum.
Trade Setup:
Entry Point: Consider entering a long position if the RSI crosses above 50, confirming bullish momentum.
Stop Loss: Set a stop loss below recent support levels to manage risk effectively.
Take Profit: Identify key resistance levels as potential take profit targets, ensuring a favorable risk-reward ratio.
Time Frame: This analysis is based on the daily chart, suggesting a medium-term trade horizon.

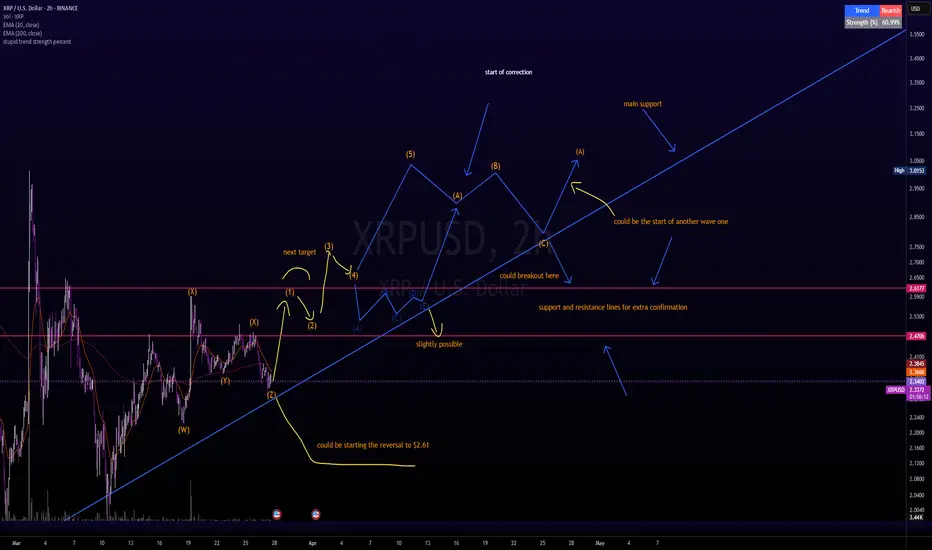
daily price prediction for xrpusd 1 day chart date:3/26/2025using the elliott wave theory and the gann fan i have found a possible outcome for xrp in the future with the price floating around 3.00$

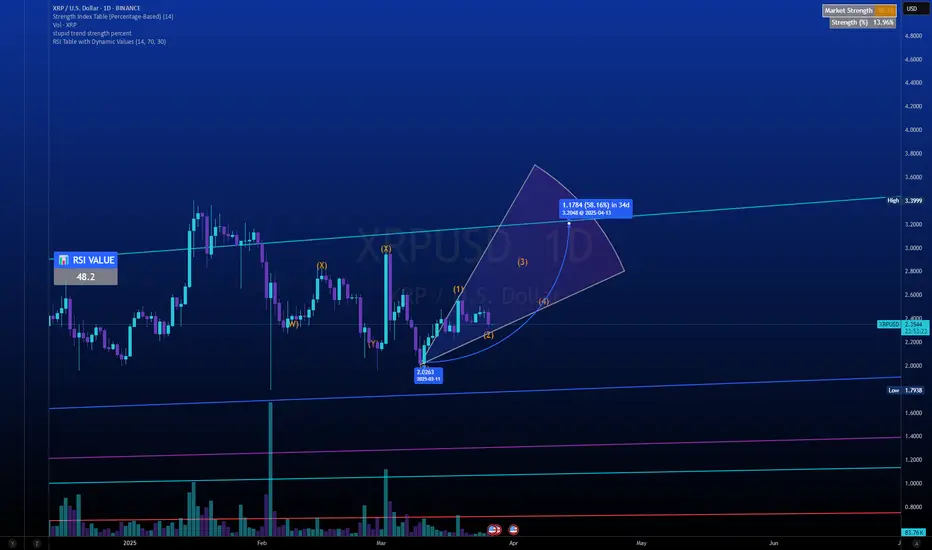
xrp 1 day chart price prediction date:3/26/2025i used the elliott wave and gann fan to find a possible outcome for xrp and the price is about 3.20$-3.40$
$200+ on the way We're currently in an ABCDE correction (forming a bull flag). We should see $200+ once we break above $3.02. It's playing out as anticipated.

0.93 Because it must be :)How’s everyone doing? My profit train just keeps on rolling :)
Money money money! LOL
We are headed to 0.93 incase you had any questions. For me that is max profit. I will close a major portion of my trade at 1.52

March 28 Is XRP's Big Day—Or At Least Better Be
Friday, March 28, 2025, marks exactly 144 days since XRP's breakout from November 4, 2024—right on cue with Gann’s "inner year" cycle, signaling a potential trend reversal (or at least a good excuse to tweet "I told you so").
Conveniently enough, March 28 is also exactly 52 days post the "flash crash" on February 3rd (if we're even calling that hiccup a crash).
The stars (or rather, candlesticks) align for Ichimoku’s Chikou Span to finally clear both the candlestick bodies and the Cloud, creating a bullish setup that even perma-bears might glance at sideways.
If XRP pulls off a daily close at or above $2.61 on March 28, expect Gann and Ichimoku fanboys to show up with wallets wide open and confidence suspiciously high.

XRP Pounced on by the group! RIPPLE XrpUsd Ready to Go? Now if you NOTE exactly where PRICE was at the EXACT TIME that 🟢SeekingPips🟢 Shared the last XRP CHART.
You can see that was a PERFECT ALIGNMENT of both TIME & PRICE.👌
ℹ️ Many SHORT TERM & INTRADAY TRADERS paid themselves at 🟢SeekingPips🟢 pre defined 🔴RED🔴 level @ 2.4980 for a PAIN FREE TRADE with A GREAT REWARD TO RISK OUTCOME.
🌎 You can also NOTE TWO VERY IMPORTANT THINGS WITH THIS TRADE...
▪︎1) Our ORIGINAL Stop Loss has still been untouched even after the 100% retracement of our original ENTRY.
▪︎2) Now anyone who was not in the group or followed 🟢SeekingPips🟢 original chart share at the time of our entry and instead decided to jump in as price was already moving up would have made a poor choice.❗️
By waiting on the next 240m bar/candle to close you could have theoretically left a limit order at original entry area and would have been easily filled for a STRESS FREE trade so far.🚀🚀🚀
What's the lesson here❓️
Know what you want to see and do not act beforehand.
If you miss your FIRST entry have a PLAN for your SECOND ATTEMPT.
Note the word PLAN.
⚠️ As per 🟢SeekingPips🟢 BIO Without A PLAN it's NOT TRADING But GAMBLING.
🎲

XRP Market Update 3.25.2025My current bias for XRP, analyzed today 3.25.25 at 7:52am.
Let me know down below your thoughts on this asset!!
Forex, Crypto and Futures Trading Risk Disclosure:
The National Futures Association (NFA) and Commodity Futures Trading Commission (CFTC), the regulatory agencies for the forex and futures markets in the United States, require that customers be informed about potential risks in trading these markets. If you do not fully understand the risks, please seek advice from an independent financial advisor before engaging in trading.
Trading forex and futures on margin carries a high level of risk and may not be suitable for all investors. The high degree of leverage can work against you as well as for you. Before deciding to trade, you should carefully consider your investment objectives, level of experience, and risk appetite.
There is a possibility of losing some or all of your initial investment, and therefore, you should not invest money that you cannot afford to lose. Be aware of the risks associated with leveraged trading and seek professional advice if necessary.
BDRipTrades Market Opinions (also applies to BDelCiel and Aligned & Wealthy LLC):
Any opinions, news, research, analysis, prices, or other information contained in my content (including live streams, videos, and posts) are provided as general market commentary only and do not constitute investment advice. BDRipTrades, BDelCiel, and Aligned & Wealthy LLC will not accept liability for any loss or damage, including but not limited to, any loss of profit, which may arise directly or indirectly from the use of or reliance on such information.
Accuracy of Information: The content I provide is subject to change at any time without notice and is intended solely for educational and informational purposes. While I strive for accuracy, I do not guarantee the completeness or reliability of any information. I am not responsible for any losses incurred due to reliance on any information shared through my platforms.
Government-Required Risk Disclaimer and Disclosure Statement:
CFTC RULE 4.41 - HYPOTHETICAL OR SIMULATED PERFORMANCE RESULTS HAVE CERTAIN LIMITATIONS. UNLIKE AN ACTUAL PERFORMANCE RECORD, SIMULATED RESULTS DO NOT REPRESENT ACTUAL TRADING. ALSO, SINCE THE TRADES HAVE NOT BEEN EXECUTED, THE RESULTS MAY HAVE UNDER-OR-OVER COMPENSATED FOR THE IMPACT, IF ANY, OF CERTAIN MARKET FACTORS, SUCH AS LACK OF LIQUIDITY. SIMULATED TRADING PROGRAMS IN GENERAL ARE ALSO SUBJECT TO THE FACT THAT THEY ARE DESIGNED WITH THE BENEFIT OF HINDSIGHT. NO REPRESENTATION IS BEING MADE THAT ANY ACCOUNT WILL OR IS LIKELY TO ACHIEVE PROFIT OR LOSSES SIMILAR TO THOSE SHOWN.
Performance results discussed in my content are hypothetical and subject to limitations. There are frequently sharp differences between hypothetical performance results and the actual results subsequently achieved by any particular trading strategy. One of the limitations of hypothetical trading results is that they do not account for real-world financial risk.
Furthermore, past performance of any trading system or strategy does not guarantee future results.
General Trading Disclaimer:
Trading in futures, forex, and other leveraged products involves substantial risk and is not appropriate for all investors.
Do not trade with money you cannot afford to lose.
I do not provide buy/sell signals, financial advice, or investment recommendations.
Any decisions you make based on my content are solely your responsibility.
By engaging with my content, including live streams, videos, educational materials, and any communication through my platforms, you acknowledge and accept that all trading decisions you make are at your own risk. BDRipTrades, BDelCiel, and Aligned & Wealthy LLC cannot and will not be held responsible for any trading losses you may incur.

Bitcoin & Altcoin Market Showing Strength Amid Stock Market Rebo📈 Market Overview:
Bitcoin is showing signs of renewed strength and is currently trading above $88,000.
The Russell 2000 is leading the stock market rally, up over 2%, historically correlated with BTC.
Bitcoin’s recent low came with bullish indicators, including RSI and MACD curling upward.
📊 Key Technical Levels:
BTC Dominance: Watching for a rejection at the 0.702 Fibonacci retracement level, signaling capital rotation into altcoins.
Support Levels: Holding above 200-week MA confirms bullish momentum.
Resistance Levels: The psychological barrier at $100,000 remains a key target.
🚀 Altcoin Market Outlook:
XRP remains stable at ~$0.246–$0.247, with potential for a breakout.
Altcoins could see a strong rally once BTC dominance starts to decline.
🔍 Final Thoughts:
Bitcoin appears to be in a grinding phase, climbing the “wall of worry” before major FOMO kicks in.
The current price action aligns with past range-bound consolidations, often unpredictable but bullish in structure.
Momentum favors the bulls, but expect volatility—just remember, choppy action is part of the process.
📢 Stay patient & follow the trend! Are you bullish or bearish? Drop your thoughts below! 🚀📉
