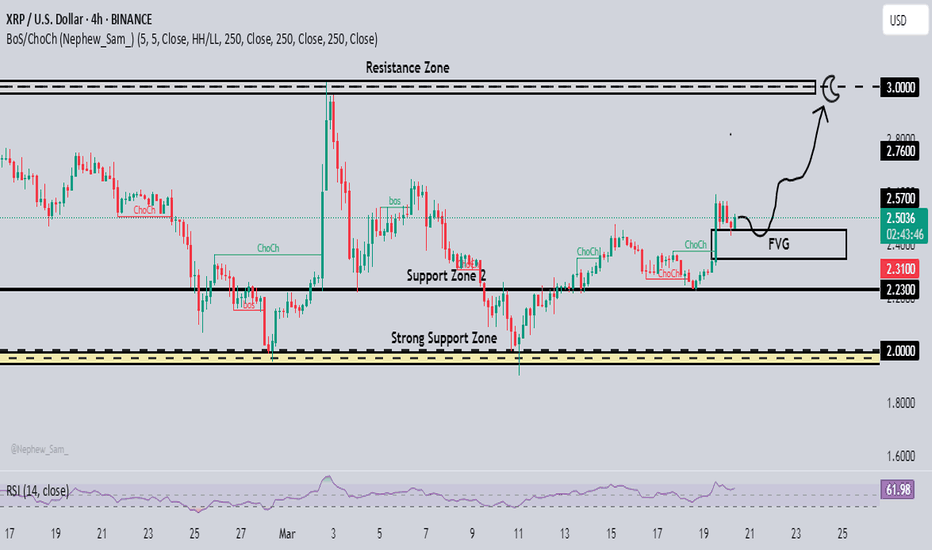
XRPUSD H1 Timeframe MARKET analysis to BullishBINANCE:XRPUSDT My Analysis XRP vs US Dollar shows a candlestick chart for XRP, a common tool in financial trading. It highlights support and resistance zones, which are key concepts in technical analysis. Key Points: First we look at the RSI which is hovering around 62.70 indicating an uptrend. On the other hand we look at Support and Resistance.
Strong Support Zone: 2.0000 Price has previously bounced off this level, suggesting buying interest.
Support Zone 2: 2.300 A recent support level, indicating a potential area for price recovery. Strong Resistance Zone: 3.3000 This is a weak strong resistance zone that could see a good chance of breaking above.
We would consider buying
XRPUSD Buy Entry Level:2.5020
TP: 2.5700
TP: 2.7600
TP: 3.0000
SL: 2.3100
XRPUSDC_9F147C.USD trade ideas
XRP Wave 5 Starting Part 2Hello There,
There is the bullish case in which we bottomed and we are heading higher with a completed sideways combo in the wave 2. Currently we could be starting Wave 3 with a Leading Diagonal in the wave 1.
Probabilities? currently looking at both cases I think the bearish case may have a slight higher probability at the moment to dip in the $1.4 - $1.9 range first before hitting that $10 range.
Either way we have at least one more bullish wave left, so plan according with your holding and risk
GOD BLESS AND TRADE ON
Stay Humble and Hungry
XRP Wave 2 or Wave B incoming Part 1Hello there,
I am presenting a bearish (short term; current post) count and a bullish count (in my next post). This is showing that we hit a truncated top (see previous posts; attached) and we are coming down in the $1.9 - $1.4 ish range to compete Wave 2 (or could be Wave B) of cycle. I see us pushing to the $2.9 - $3.2 ish range to finish the C wave of the Major wave B of the wave 2 before finishing. it seems to me that we are making a Flat in this sideways chop.
please review and ask me any questions
GOD BLESS AND TRADE ON
Stay Humble and Hungry
* POST FOMC UPDATE *Great day for crypto and XRP today!
Not only because of the long awaited update on SEC case that came from Brad G, but also the pump created post FOMC today.
If you have been following my analysis, you are aware that price has been traveling as predicted. HOWEVER, it is still early to claim anything .
News pump definitely shakes up the market, but only after things are calmed down that we can see where we are.
I am still looking for a strong break of the $2.6 level(purple horizontal line) to confirm my bullish bias.
To keep things bullish, I have below 2 scenarios that I can see happening.
Scenario 1:
That's the scenario I showed you before.
In this scenario, Wave 1 peaks below the confirmation level, charges up on wave 2 and blasts through on wave 3. Price was moving slow and steady, but it was still following this path that I had shared with you all.
Scenario 2:
With the news that came out today, it becomes a little more risky to predict price movement.
Even though XRP pumped above the previous Wave 1 price, it still hasn't broke the $2.6 key level and is now showing signs of resistance around the level. With that in mind, it is possible that the peak you saw today is our new Wave 1, and price could retrace back (possibly even less than what is shown in the chart if buyers can defend that $2.3 support) before we go for the confirmation breakout.
On both scenarios, I expect price to move slow just like in the beginning of last pump, when price movement caught many by surprise and the FOMO meter went off the charts. I am also basing these scenarios on the idea that this pump might be near its end
Although I am just bringing up my bullish bias, there is still possibility of price going back towards $2 or lower to finish this consolidation phase. But I do believe that the crypto market has found its bottom, or at least we are pretty close.
What we must do now is take a nap and wake up when trading view send us the alert that will make husbands leave their wives and the unemployment rate to soar(iykyk).
For right now, let's remind ourselves that we are just observers of the market and that no one knows what the gods of the chart have planned for the future.
XRP SEC CASE WILL BE DROPPEDFellow crypto market betters,
As you are all aware, daddy Brad announced that XRP case will be dropped and the price jumped from the news alone.
I haven't seen any SEC announcements about the price yet, and today we do have some FOMC decisions coming out.
IN MY OPINION:
1) Be careful with the whole "Buy the rumor, sell the news" dumb money thing.
2) Although price looks like it is going towards target 3, it can still go down depending on what news comes out of FOMC.
News makes analysis a little more difficult because the volume and price action are many times just a "synthetic" data. It goes away pretty quick, and the price goes back to where it is supposed to be.
One interesting data that I kinda don't know what to think about it yet is shown in the charts.
- Both XRP and ADA have broken trend resistances in price and RSI. The pump for ADA wasn't as strong as for XRP so there's still indecision, even with the news pump we had today.
At the end of the day, congratulate your XRP supremacist who've been bothering you for the past 4 years for you to buy XRP and remained faithful through the ups and downs this drama took them.
XRP Update | $5Similar accumulation pattern to what we've seen last year December. Price action is holding up nicely above the 150d SMA on a daily TF with bullish closes also sitting above the 8d SMA.
Volume is looking very good too with price sitting above the value area.
I'm using the fibonacci extension to get a local target of $5.
XRPUSD breaking upward from invh&sTarget is $3. Very likely to hit the full target based on the bullish momentum from the sec ripple appeal being ofifcially dropped. Likely to continue upward from there as well but for this current idea I only wanna focus on the inv h&s target. *not financial advice*
XRP’s Bullish Setup: Why I’m Targeting $3 with a 1:4 Risk-RewardAfter its recent impressive rally to $3, XRP has shown remarkable resilience during the correction, establishing a strong support level around the $2 mark.
Despite the broader downturn in the crypto market, XRP has held up well, demonstrating significant strength.
Last week, XRP tested this $2 support level once again and rebounded, reinforcing its stability. The current price action is shaping a bullish flag pattern, which suggests that a new upward move could be on the horizon.
With this in mind, I am looking to buy XRP, anticipating a potential breakout.
Given my target of around $3, I am aiming for a 1:4 risk-reward ratio for this trade
XRP/USD Skyrockets to the MoonXRP/USD Breakout Alert! After consolidating below key resistance around $2.107, XRP has surged to $7.25, hitting a target gain of 7.25x! The price has broken through multiple resistance levels, showing strong bullish momentum. Are we heading for new all-time highs? Let’s discuss!
#XRP FINAL DIP BEFORE NEW ATH?XRP is creating LHs and looks to be heading for a final dip to the long-term upward trendline (purple) which would make this correction complete.
The ideal scenario is that XRP will complete this correction and with bullish momentum will reach a new ATH within the next 2 months, however, let's see how XRP reacts to this critical support first!
Correction Is Not Over For Ripple XRPHello, Skyrexians!
It's time to update our BINANCE:XRPUSDT analysis because the previous one caused a lot of misunderstanding. Today we will clarify our point of view for this fundamentally strong crypto.
Let's take a look at the weekly chart. Here we can see that price is forming Elliott waves cycle in the current bull run. Looking at the Awesome Oscillator we can say that wave 3 has been just finished and now XRP is in wave 4. Wave 4 will be finished when Awesome Oscillator crosses zero line, so now we have some space to continue correction. The Fibonacci target for wave 4 has been reached, but it can be retested again.
Wave 5 target is located at $3.88. In next to this price we will see the red dot on the Bullish/Bearish Reversal Bar Indicator it's going to be the strong reversal signal for the bear market start.
Best regards,
Skyrexio Team
___________________________________________________________
Please, boost this article and subscribe our page if you like analysis!
For a clean look of xrp on the 3D chart to hit the Sell areaFor a clean look of xrp on the 3D chart to hit the Sell area.
I too am aware of the 56 66 76 and 86 Cent areas but they're not coming just yet we got a hit a double top before it comes down that area is at the $3.24 line for selling I'm selling at the three orange line just below the red line my xrp and then buying much much lower.
This is most certainly meant to shake everyone out and then it's going to be an explosive move up but God can't go before it goes down!
XRP Next Move !... $4 XRPUSD Ripple Just A Matter Of Time? $€£¥This space seems a bit quite now but if you liked XRPUSD / XRPUSDT at $3 what has changed now?
When the hype is around thats the time to be ⚠️ cautious IMO.
When there is little attention of the said market thats when 🟢SeekingPips🟢 likes to get to work.
⚠️This time is NO different⚠️
NOT SURE WHERE THE NEXT LOW WILL FORM❓️
ME NEITHER❗️❕️❗️
🟢 You don't need to know❗️ You just need to HAVE A PLAN ✅️
My current XRP 'flash crash in April' thesis chartThis is the current chart that I'm using, which includes approximate areas and an approximate timeline for my coming 'flash crash in April' thesis. This involves XRP bottoming out very soon, then going on a 'false breakout' heading into April, followed by a flash crash sometime in mid to late April. This will then mark the low of this area of the chart, and the real breakout will occur sometime in May, which I believe will take XRP to a new all-time high and true price discovery.
Keep in mind that this is a theory, which is developing day by day, and may or may not actually come to fruition. It's based on a chart I've released in the past called 'THE XRP BREAKOUT CHART.'
*** The yellow line on the chart is a simple wave count, and not affiliated with Elliot Wave Theory, just for clarification.
Enjoy the ride.
Good luck, and always use a stop loss!
The Top Indicator is up XRP. to $3.24The Top Indicator is up in. The lower Bollinger Band which means Buy or Hold.
The MACD is 7 1/2 Days in. Reversal
RSI is still in negative territory.
2 of 3 signals say this is ggoing up.
I'm holding to see what happens at 2.52 area however, I see the target at $3.24 before selling at moment and I'm putting my sell order in
XRP - How deep can we go? XRP - The polarising project that everyone loves to hate!
Nevertheless, XRP is here to stay.
After being gifted with some hefty gains Q4 24 into Q1 25 due to various fundamental factors (BTC breaks ATH, USA going pro-crypto, further speculative advantages ) the token has recently hit a ceiling around ATH; where price has chopped between $2 and $3.25. recent discussions around the strategic reserve have failed to ignite any major price action; stifled by ongoing SEC deliberations which maintain elements of uncertainty regarding regulatory clarity.
Many theories around the future of this bull run and the future of the crypto sphere in general are diverse. One thing for certain, is the present market does not bide well to supporting an aggressive breakout in the immediate term. With ongoing conflict, inconsistent messaging from the US, and wider market influences (Stocks, FX and others becoming increasingly over inflated) risk on assets are not front of mind right now.
With this said, what is interesting is that large imbalances have been left before or after consolidation; with areas of note being $1 and $1.69 respectively. $2 has developed as a very strong support; thus break below here could see sustained downturn in price action until clarity is provided around the future of the project. Given most crypto assets are hovering around highs or ATH's the market too provides little upside opportunity compared to downside risk. If I was a MM; I would want to be positioned much lower in case of major financial unrest in other markets to hedge against potential losses.
Imbalances provide such an opportunity and would be accessed through a black swan event, or other narrative influenced price action. As such, my outlook for the immediate term is expect a very tumultuous 3-6 months. Don't be surprised if mainstream media get behind a FUD narrative, and the retail pile on commences.
My call - Atleast another retest of the $2 psychological support level. Break here; we are headed straight for $1.69 which would be a great buy. Enough Mainstream FUD; and retailers could be caught in shorts below this price down to around the $1.00 level. Both levels offer amazing long term RR opportunities.
XRP - Bearish lookout ahead?Hey, I think XRP might be bearish for the next few days. It just broke out of its pattern, which usually means a downturn is coming. The price has been looking a bit unstable lately, and if it can't hold its current support levels, we might see a significant drop. I'm keeping an eye on it, but for now, it seems like the momentum is shifting towards a bearish trend. Let's see how it plays out!
Let me know what you think!
*XRP, THE BULL MARKET'S HERALD*Hello again Degenerates,
Who would've thought that we would have gotten some exciting moves happening on a Sunday night.
I had to run back from the gym to watch it with some popcorn as a bunch of bulls play with heritance of my children. Fun times.
However, I would like to get away from the Bitcoin Wars and analyze a little of what is happening in XRP.
- Last week, XRP price action filled me with hopium as price traveled in a tight channel which, for noobies like me, looks exactly like what a Leading Diagonal Wave 1 would look like.
So I went back to the chart when did some doodles that you can now see on your screen.
- Per my analysis, XRP looks like it has gone through an ABC Flat Correction that ended last week and is not starting the first impulse wave of a Macro Wave 3 (or 5 depending on where you start your Elliot Waves cycle.)
- If I am correct, this Wave 1 will have a price target of $3, than we would go in a short Wave 2 and immediately jump into a bullish Wave 3.
- Zooming in to where we are right now, don't be surprised if price dumps into that purple zone highlighted in the chart, that is our PT for W2 of W1 of W3(or 5). It could even go lower, but i don't expect it would.
The fact is, if you took profits, great. If you didn't, get ready, because we are now in the playground for the Manipulators, preying on liquidity that some butter hands will regrettably give to them.
This is my bullish scenario for XRP anyway. If you want to see my bearish scenario, you can check the post I made on the ADA chart in the link below:
*As always, I'm just an observer of the market attempting to decipher it's hidden secrets. This is not a financial Advice.*


