My current XRP 'flash crash in April' thesis chartThis is the current chart that I'm using, which includes approximate areas and an approximate timeline for my coming 'flash crash in April' thesis. This involves XRP bottoming out very soon, then going on a 'false breakout' heading into April, followed by a flash crash sometime in mid to late April. This will then mark the low of this area of the chart, and the real breakout will occur sometime in May, which I believe will take XRP to a new all-time high and true price discovery.
Keep in mind that this is a theory, which is developing day by day, and may or may not actually come to fruition. It's based on a chart I've released in the past called 'THE XRP BREAKOUT CHART.'
*** The yellow line on the chart is a simple wave count, and not affiliated with Elliot Wave Theory, just for clarification.
Enjoy the ride.
Good luck, and always use a stop loss!
XRPUSDC_D17776.USD trade ideas

The Top Indicator is up XRP. to $3.24The Top Indicator is up in. The lower Bollinger Band which means Buy or Hold.
The MACD is 7 1/2 Days in. Reversal
RSI is still in negative territory.
2 of 3 signals say this is ggoing up.
I'm holding to see what happens at 2.52 area however, I see the target at $3.24 before selling at moment and I'm putting my sell order in

Large movement is ready. Any day this week.Huge move is inevitable soon. We could see it before Thursday! See you at the bottom for some juicy profit!

XRP - How deep can we go? XRP - The polarising project that everyone loves to hate!
Nevertheless, XRP is here to stay.
After being gifted with some hefty gains Q4 24 into Q1 25 due to various fundamental factors (BTC breaks ATH, USA going pro-crypto, further speculative advantages ) the token has recently hit a ceiling around ATH; where price has chopped between $2 and $3.25. recent discussions around the strategic reserve have failed to ignite any major price action; stifled by ongoing SEC deliberations which maintain elements of uncertainty regarding regulatory clarity.
Many theories around the future of this bull run and the future of the crypto sphere in general are diverse. One thing for certain, is the present market does not bide well to supporting an aggressive breakout in the immediate term. With ongoing conflict, inconsistent messaging from the US, and wider market influences (Stocks, FX and others becoming increasingly over inflated) risk on assets are not front of mind right now.
With this said, what is interesting is that large imbalances have been left before or after consolidation; with areas of note being $1 and $1.69 respectively. $2 has developed as a very strong support; thus break below here could see sustained downturn in price action until clarity is provided around the future of the project. Given most crypto assets are hovering around highs or ATH's the market too provides little upside opportunity compared to downside risk. If I was a MM; I would want to be positioned much lower in case of major financial unrest in other markets to hedge against potential losses.
Imbalances provide such an opportunity and would be accessed through a black swan event, or other narrative influenced price action. As such, my outlook for the immediate term is expect a very tumultuous 3-6 months. Don't be surprised if mainstream media get behind a FUD narrative, and the retail pile on commences.
My call - Atleast another retest of the $2 psychological support level. Break here; we are headed straight for $1.69 which would be a great buy. Enough Mainstream FUD; and retailers could be caught in shorts below this price down to around the $1.00 level. Both levels offer amazing long term RR opportunities.

XRP - Bearish lookout ahead?Hey, I think XRP might be bearish for the next few days. It just broke out of its pattern, which usually means a downturn is coming. The price has been looking a bit unstable lately, and if it can't hold its current support levels, we might see a significant drop. I'm keeping an eye on it, but for now, it seems like the momentum is shifting towards a bearish trend. Let's see how it plays out!
Let me know what you think!

*XRP, THE BULL MARKET'S HERALD*Hello again Degenerates,
Who would've thought that we would have gotten some exciting moves happening on a Sunday night.
I had to run back from the gym to watch it with some popcorn as a bunch of bulls play with heritance of my children. Fun times.
However, I would like to get away from the Bitcoin Wars and analyze a little of what is happening in XRP.
- Last week, XRP price action filled me with hopium as price traveled in a tight channel which, for noobies like me, looks exactly like what a Leading Diagonal Wave 1 would look like.
So I went back to the chart when did some doodles that you can now see on your screen.
- Per my analysis, XRP looks like it has gone through an ABC Flat Correction that ended last week and is not starting the first impulse wave of a Macro Wave 3 (or 5 depending on where you start your Elliot Waves cycle.)
- If I am correct, this Wave 1 will have a price target of $3, than we would go in a short Wave 2 and immediately jump into a bullish Wave 3.
- Zooming in to where we are right now, don't be surprised if price dumps into that purple zone highlighted in the chart, that is our PT for W2 of W1 of W3(or 5). It could even go lower, but i don't expect it would.
The fact is, if you took profits, great. If you didn't, get ready, because we are now in the playground for the Manipulators, preying on liquidity that some butter hands will regrettably give to them.
This is my bullish scenario for XRP anyway. If you want to see my bearish scenario, you can check the post I made on the ADA chart in the link below:
*As always, I'm just an observer of the market attempting to decipher it's hidden secrets. This is not a financial Advice.*

Retest of channel breakout on micro time frame. Broke out of downward channel. 4hr chart. Retest and now moving up in a wave 3 impulse to carry us past $3 and hopefully to $4 by wave 5. When complete in its entirety this is wave 1 of a larger wave 5 on the macro scale to take us to $6-$8

Get your shorts in! 0.93 incoming.Just put in my short this week at 2.42
Going to be a very profitable week!

Looks like xrp is going to hit 2.19355Looks like xrp is going to hit 2.19355.
The 6 Hour Chart appears in a downtrend. SOLD just now to buy lower at $2.19355

XRP – Triangle Formation in Play?XRP could be forming a potential triangle pattern, signalling a major breakout ahead. 📈📉 Keep a close watch on key levels—volatility could be incoming! ⚡

Xrp targets are within the circle and from there we go to $2.52Xrp targets are within the circle and from there we go to $2.52
Once we reach the $2.52 mark this is going lower it could go as low as 57 to 85 cents.
Not Financial advice but this is what I'm doing I'm buying it the three separate areas 2.27 2.25 and a 2.23

XRP SHORTPrice has been respecting bearish orderflow so far, 1st entry triggerd around midnight EST... lets see how this second entry plays out...

The Lawsuit is ending As most of yall need to pay attention for the news for XRP. So this needs to play out. The key support is exactly around 2$ even and the support is at $2.15 however... the lawsuit is ending so 60% gain can happen to hit 4$ alright. So now the key support has to stay strong and then need to break above $2.60 before breaking above $2.49 first.
I am long still so i suggest keep the sharp eye to the key support because it will dip nearly right there.
( HINT HINT.. XRP STILL EYEING 3$ then $15 TARGET )

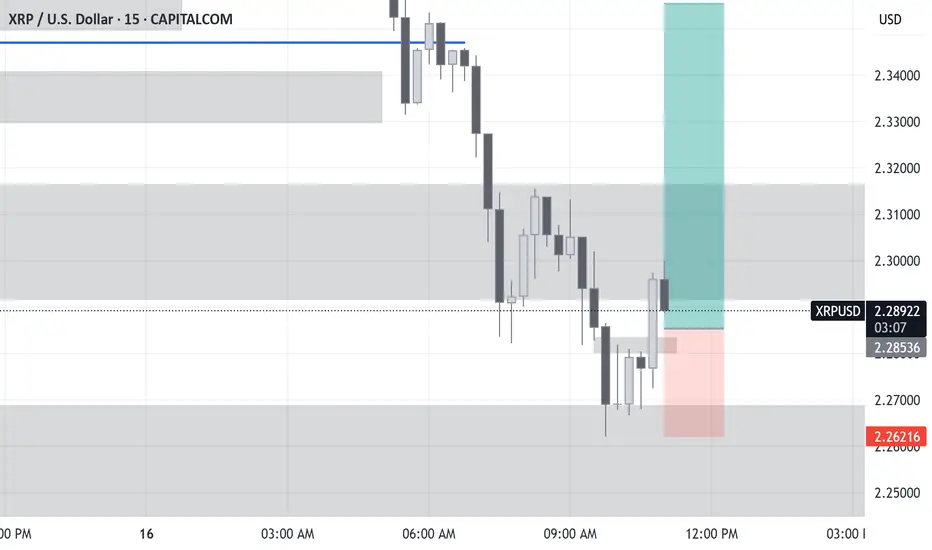
And this is where we are at with xrpAnd this is where we are at with xrp.
What goes up must come down and if we're going to trade we should trade no lower than the four hour time frame so I'm showing you that now.
The red dots are resistance turn support as were the arrow Is pointing so we should expect a bounce from there. $2.35 - I'd expect to buy in at.
Plan "a" is what you'd expect under normal circumstances...
Plan. "B" is what's gonna happen
$2.269 is the Target!
We are heading towards the targets that I spoke of earlier in previous posts!
Just thought it would havve happened sooner!
This is going to happen fast, a falling knife and Imma gonna capture it!
THE BUY BACK IS: $2.269 all in!

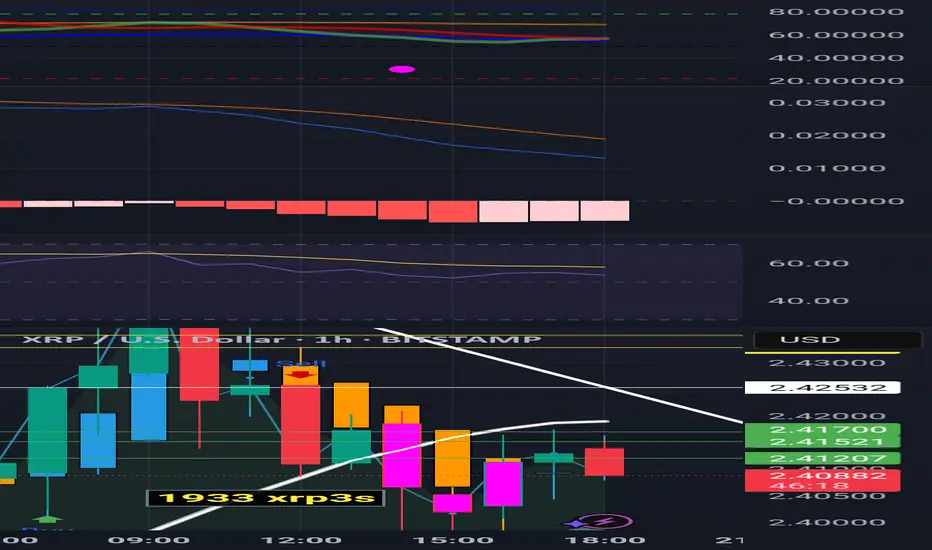
Xrp is about to take a further dumpTake a look at the 4-Hour chart for xrp3s or any other exchange where you're able to Short xrp the 4-Hour chart use the SAR indicator and you will find that the short is at the bottom of the chart and with the SAR it's about to squeeze and the shorts are about to win while the loans are about to lose xrp is going down

I'm seeing $2.933I'm seeing $2.933
I shouldn't any longer ignore that XRP is above the 21 Day MA on the Daily!
Bullish as hell!
Correct now for bigger ggains

XRP Headed to 0.93XRP is headed down. Don’t let any up movement fool you. Get out and wait for a new entry.

So with the new day and the new blue volume candleSo with the new day and the new blue volume candle.
You note that the four yellow line still exist and are accommodated by the new blue candle we may see this do a double top at the $2.38 Mark but then I anticipate it's going to pull back to the $2.26 area the first 50% byline area overall it will be an up move but it has to come down to cool off and allow investors to take some profit off the table


Adjusted Fibonacci Sequence due to the higher priceAdjusted Fibonacci Sequence due to the higher price
All else is as is I'm buying lower did not chase this candle sold it $2.32 I believe that that was the top of $2.38 it caused the Divergence and now the price reverses once it hits the 50% line I'm going to sell my xrp 3s short and by long $7,777 which is 50% of my Holdings and by lower if necessary

XRP Approaches Critical Support at $2.00Key Technical Level:
XRP is testing the strong $2.00 support level, which has consistently acted as a key price floor since December.
Descending Triangle Formation:
The price action is forming a descending triangle, where decreasing volatility suggests an imminent breakout. This pattern emerges as XRP approaches the intersection of descending resistance and horizontal support.
Bullish or Bearish?
A confirmed breakout above resistance could trigger a strong rally.
A sustained drop below $2.00 would invalidate the bullish outlook, potentially leading to a retracement toward $1.60-$1.80.
Market Perspective:
XRP’s rally from $0.60 to over $3.40 since November suggests that the current correction is likely a phase of profit-taking rather than a full trend reversal. However, traders should remain cautious and watch for confirmation of direction.
Stay alert—XRP is at a decisive moment! 🚀📉
#XRP #Crypto #MarketAnalysis #Trading #TechnicalAnalysis #Cryptocurrency #Bullish #SupportLevel
