XRP currency analysisAccording to the daily chart, the flag pattern is formed, which can grow up to the specified level according to the open conditions and the break of the line. This is just an analysis.
XRPUSDT.P trade ideas

XRP/USDT 4H Timeframe AnalysisXRP/USDT 4H Timeframe Analysis
Trend Analysis
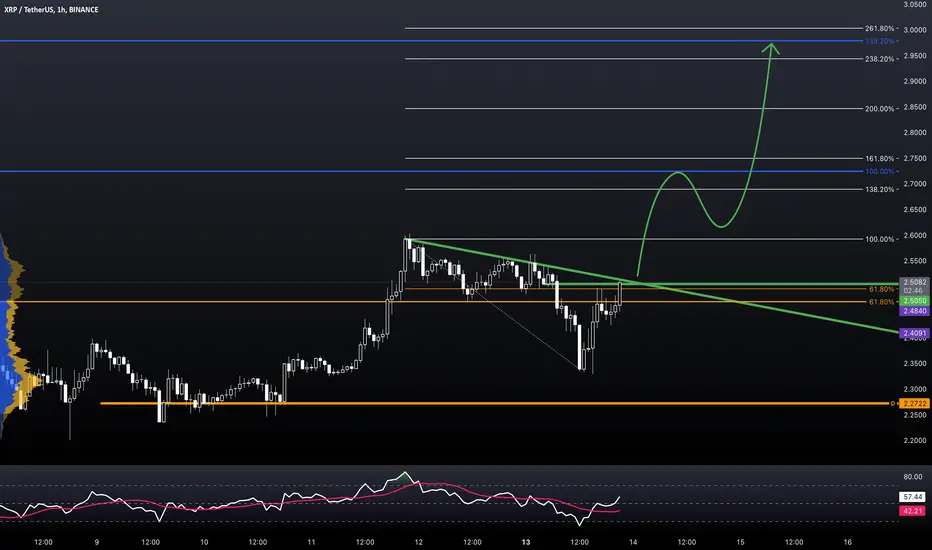
On the 4-hour timeframe, XRP/USDT is in an uptrend, forming a symmetrical triangle pattern. A downtrend line with three confirmed touches served as solid resistance, eventually breaking out and forming the symmetrical pattern.
Recently, the price broke above the minor key resistance at 2.4800, signaling bullish momentum. After accumulating buyers’ orders, the price briefly dipped to hunt liquidity below the minor resistance, where buyers had placed stop-losses.
Following the liquidity hunt, the price rebounded strongly, breaking above the minor resistance again. The current price action suggests potential bullish continuation, especially as the market reacts to news impacting XRP’s legal developments.
Price Action Expectation:
Our objective is to wait for a retest of the minor resistance (now turned support) at 2.5040.
Wait for the price to consolidate around this level, confirming strong buyer interest.
Monitor for a bullish reaction at the retest point, which validates the continuation of the uptrend.
After the retest, expect the price to rally toward the next significant resistance level.
Trade Setup-
Trade Type: Buy Limit (Retest Entry)
Entry: 2.5040 (upon confirmation of the retest)
Stop Loss: 2.3350 (below the liquidity zone to avoid false breakouts)
Take Profit: 2.9070 (next significant resistance level)
This setup requires patience and discipline to ensure all conditions are met before entering the trade.
News Catalyst
The recent increase in buying pressure for XRP is attributed to a notable update regarding Ripple's legal battle with the SEC. A prominent lawyer's insights on the SEC’s appeal have boosted market sentiment, reinforcing confidence in Ripple's position. This news has supported XRP’s bullish momentum and aligns with the current technical outlook.
Conclusion:
XRP/USDT shows strong bullish potential supported by a clear breakout pattern and positive news sentiment. The strategy emphasizes disciplined execution and proper validation of the retest to confirm the setup.
Risk Management:
Maintain a 1:2+ risk-to-reward ratio to optimize trade outcomes.
Position size should align with your account equity to manage risk effectively.
Monitor liquidity zones closely to avoid premature stop-outs.
Trading involves significant risks and is not suitable for all investors. Always:
Seek advice from a financial professional if unsure about trading decisions.

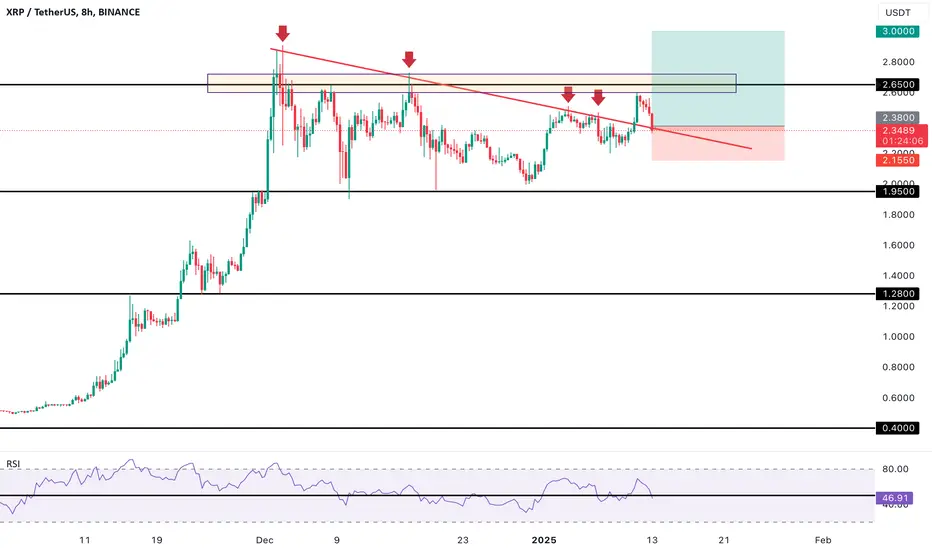
Ripple - XRP trade ideas Would love to trade the fake out of the triangle from either side
Short - region of resistance 2.53 - 2.60$
Long - region of support 2.13 - 2.00$

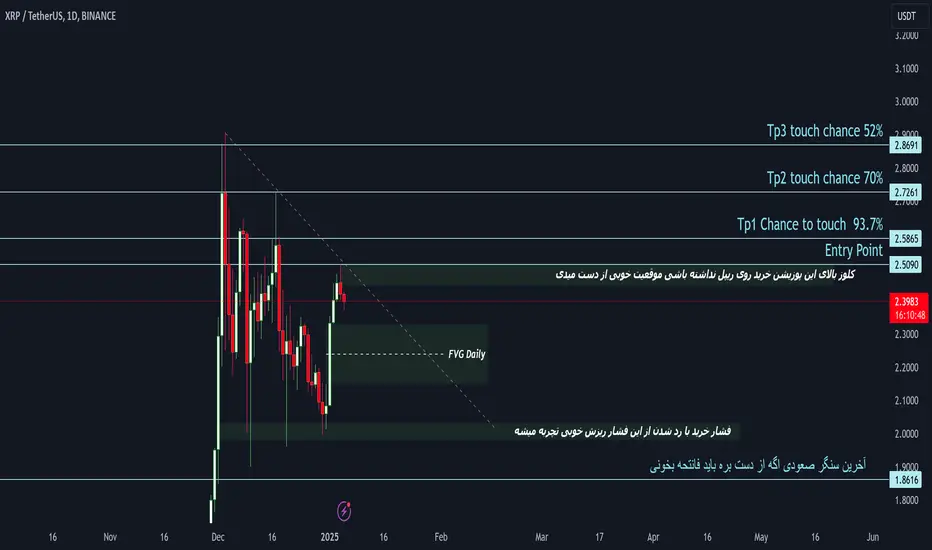
RIPPLE // countertrend breakThe market is at the countertrend break, daily fibo levels are the targets.
KEEP IT SIMPLE!
———
Orange lines represent impulse bases on major timeframes, signaling the direction and validity of the prevailing trend by acting as key levels where significant momentum originated.
Level colors:
Daily - blue
Weekly - purple
Monthly - magenta
H4 - aqua
Long trigger - green
Short trigger - red
———
Stay grounded, stay present. 🏄🏼♂️
<<please boost 🚀 if you enjoy💚
Strong XRP breakoutLoads of momentum, XRP ETF hype, Brad Garlinghouse + Trump photo
Could be a good one to trail up

XRPUSDT Bulish PatternRipple shows strong signs of a bullish trend following a long period of correction within a symmetrical triangle pattern.
Breaking through the resistance line suggests a likely continuation of the upward trend.
The price is expected to soon reach the 2.7000 level and potentially surpass the all-time high to reach 2.800, a psychological level.

Short term TA for XRP XRP is currently consolidating within a narrow range between 2.37 and 2.38, following a recent upward move. While a decisive breakout above the 2.40 resistance level remains pending, this consolidation period could be interpreted as a sign of strength.
In the near term, a cautious outlook is warranted as the price has yet to confirm a sustained upward trajectory. However, the current price action may be indicative of accumulation and base-building, potentially setting the stage for a future advance.
Longer-term prospects for XRP appear positive, with the cryptocurrency demonstrating a consistent pattern of higher highs and higher lows. This suggests an underlying bullish trend, although patience may be required for further upside momentum to materialize.
Traders and investors are advised to closely monitor key indicators such as trading volume and momentum, as well as news and developments related to XRP, to gauge the likelihood of a breakout and subsequent price appreciation.

XRp is Still on #MiracleHEllo there
I will enter to Long postions by the time price passed last high and there are some other reasons for this suggestion
one of them candle stick pattern in daily time frame that could be broken to go reverse ( Reversal pinbar )
#TradeWithMky
I suggest a long postions after Green Area
stop Lost blow last low
Good luck
XRP IdeaXRP has formed a valid descending trendline and broke the last touch of the trendline
Now its retesting it so we’re entering a buy position
GOOD Luck family
Follow us for more idea and analysis
This is worrying, is the rising wedge playing out?I previously pointed out a rising wedge in an idea of mine, it appears it could be forming. This really isn't good news. Targets are labelled on graph.
BINANCE:BTCUSDT is also dragging the price down which makes pattern validation more likely. BTC has also broke below the neckline on the H&S (high time frames) and Double Top (low time frames). This is very concerning, how will WS market react. There is a lot of fundamentals coming out this week, this could get very bloody.
People saying this is a re-test of our so called 'symmetrical' triangle. I'm still not sure.
I have been scalping the patterns so either way not too bothered about price action right now but this is genuinely concerning for the future of XRP.

XRP at a Crossroads: Key Indicators Signal a Potential Reversal XRP is currently at a critical juncture in its price trajectory, with technical indicators suggesting a pivotal moment for traders and investors. The Moving Average indicator is reflecting consolidation around key levels, signaling uncertainty about the coin’s next move. The Price Percentage Oscillator, a momentum-based metric, highlights a potential bullish divergence, indicating a growing possibility of upward movement if buying pressure persists. This aligns with the RSI), which is hovering near oversold territory, historically signaling a potential buy opportunity for those looking to capitalize on a reversal.
In the short term, XRP’s support and resistance levels are crucial. The recent dip has brought the price into a range that sits just above the $2.00 to $2.20 zone, a level that has previously acted as a strong support during market downturns. If XRP can hold this zone and the RSI remains supportive, it could provide the momentum needed for a rebound. Conversely, failure to maintain this level could result in further downside pressure, making the current crossroads significant for its medium-term outlook.
Traders should closely monitor these indicators as they point to a potential reversal but also emphasize the fragility of the current market sentiment. A decisive move above resistance levels could open the door to reclaiming higher price points, but caution is warranted until confirmation signals emerge. This juncture presents both opportunity and risk, making disciplined strategies essential for navigating the next phase in XRP’s price action.

SHORT TERM analysis scalp/swing idea Oh boy.... I don't typically trade short I feel like I'm betting against my investments but I think this needs to be said ....
CRYPTOCAP:XRP had a beautiful price spike yesterday if you got in and snagged it, yay you, enjoy your bag 💰
Upon analyze charts this morning I'm seeing some disturbing bearishness upon us. But with all the crazy price action yesterday I think it needs to cool so we can move forward and sustain new highs.
Support Levels :
The immediate support level lies around 2.3873. A break below this level could trigger further downside.
The next significant support level is around 2.3154.
Moving Averages :
The 20-period and 50-period moving averages are sloping downwards. If the price continues to decline and breaks below these moving averages, it could signal further bearish momentum.
Bollinger Bands:
The price is currently trading below the lower Bollinger Band. If the price remains below this band for an extended period, it could indicate a continuation of the bearish trend.
Overall Market Sentiment: A bearish sentiment in the broader cryptocurrency market could exacerbate the decline in XRP.
Personally I have a short order triggering at $2.4850 with a STOP loss set at 5.52 and a take profit at $2.30, $2.25, and $2.
I would be cautious entering any new long positions above $2.50, let Monday morning come before making any hasty decisions. Rather have fomo than loss imo.
None of what I say should be considered financial advice. Just the outlook of a second set of eyes. Do your own research. Take what reasonates, leave the rest.
All my love ❤️

XRP to the moonXRP breakout of Bullish flag in Daily time frame.
Target can be big as its a breakout in Daily time frame.
Min. Target for me is $3.5

XRP Short Scalp IdeaGot into this short trade in XRP.
Looks like it tap into the Key Level on the 15 min TF, and we're getting a little rejection from it.
Risk is small, and Stop Loss is tight. Only bet what you can loose.
Entry: 2.5414
SL: 2.5671
Target: 2.4824
Risk/Reward : 2.25
Trail SL once price nears the profit target. Trade on your own risk.
Happy Trading!

Are we about to test new heights?Bull Pennant appears to have formed on the 1H timeframe, this would be targeting $2.6 region. If this resistance broke, the target of the pennant would be $2.8.
We've also broken out of the symmetrical triangle with the overall target being $4.9
Will this pennant breakout and re-test of $2.6 or fail and fall back down to the symmetrical triangles resistance? We'll soon find out.
12H candle appears to possibly be forming a morning star doji which would signal continuation of upwards momentum. BTC also appears to be forming a morning star on 12H and has also formed a bullish pennant on 2H timeframe. Could this be the time to shine and test new heights? I'm still not sure.
Some of my concerns for XRP right now is the upcoming SEC case, which could put downwards pressure on the market, we also don't know how Trump coming into office will effect the market. Will it dump then pump? We don't know. This breakout is stale, the volume has drastically decreased which is worrying. XRP has a reoccurring theme of selling false moves. $2.6 seems to be a region we're incapable of breaking.
I have taken profit on my short from $2.591 to $2.48 and have now entered a long position just above the bottom of the pennants support. I've also set a tight stop loss on this due to volatile market conditions.
Thank you for taking the time to review my idea, if you have any feedback please feel free to comment. All feedback is greatly appreciated.

Fractal contracting triangleThis is the first correction outside of the wave 2 contracting triangle, and is recreating it in miniature.
My bias is that this triangle fails and price retests the top of the primary triangle. A failed minor triangle will put the willies into traders that the primary triangle will also fail.
I will be standing by trying to assess each step, and although I expect a retest, it isn’t necessary

XRPUSDT - neutral patternhi traders,
Since the beginning of December, XRPUSDT has been consolidating and forming the symmetrical triangle pattern.
This corrective structure may bring us more upside in the next days but as it's a neutral pattern, there's a probability that it will break down too.
How to position yourself?
1. If the price breaks to the upside, enter the long position. Target for longs: 3,40 - 3,50$.
2. If the price breaks down, bears will target the zone between 1 and 1,20 $.
In either scenario, look for the volume increase to avoid trading the false breakout.
Good luck!

XRP ANALYSIS 🌸#XRP Analysis : Bullish Trend 🚀🚀
🚀As we can see that #XRP was making higher highs and higher lows. But finally we can see a breakout of flag and pole pattern. It indicates a bullish trend after it retest the inclining trendline. 💲💲
🔖 Current Price: $2.5454
⏳️ Target Price: $2.7055
⁉️ What to do?
- We can trade according to the #XRP chart and make some profits. Keep your eyes on chart price action, observe trading volume. Always observe market sentiments and update yourself everyday.🔰🔰
🏷Remember, the crypto market is dynamic in nature and changes rapidly, so always use stop loss and take proper knowledge before investments.
#XRP #Cryptocurrency #Breakout #TechnicalAnalysis #DYOR

XRP BullishXRP has broken out from sysmetrical traible on 15 min time frame after restesting the key support levels and gained momentum and is expected to Reach 2.60 price.

XRP Wave 5 is missingHey
IMO wave 5 is still missing here
Wave 4 can be completed or can become more complex
Join me on X


XRP BULLISH AS WELL AS BEARISH VIEWBINANCE:XRPUSDT.P IT SEEMS LIKE ALL CRYPTS ARE TRADING IN A RANGE
It might give a bullish breakout and move much higher
but in Dogecoin there is short setup
So it can go any direction
Also there is no hot liquidity

XRP USDTThe markets can stay irrational longer than you can stay solvent - John Maynard Keynes
Be solvent people.
NFA
