Trump vs. the BRICS and rippleXRPUSDT only rises on news, not facts. A cryptocurrency instrument that will take your money away from you in the future.
Trump vs. BRICS. BRICS countries could face duties of 100% if they introduce a single currency, Donald Trump has said.
Ripple and the BRICS countries are considering using Ripple's technology and digital asset XRP for inter-state transactions. This is in line with the BRICS countries' goals to reduce dependence on the US dollar and create an independent financial system
XRPUSDT.P trade ideas

BUY XRPhello friends
Ripple, which was in a triangle pattern, has now managed to break it and pull back to the ceiling of the triangle, we enter into a purchase transaction with capital management.
*Trade safely with us*

XRP update#XRP made a divergence in its last 2 highs i think that there should be a correction after this amount of rising and we have a good demand zone also there is a good liquidity volume under the last low (around 1.77 $) so its better to wait for a good correction before entering a long position

XRP at Critical Level – Major Move Incoming! Bullish OR BearishCurrent Market Structure:
#XRP is in a downtrend and has recently broken a key support level, signaling potential further downside. However, a Bullish Harmonic Pattern is forming on the 4H timeframe, which could indicate a possible trend reversal.
Key Technical to Watch:
🔹 Bearish Scenario: If #XRP continues to reject resistance and fails to reclaim lost support, the bearish trend may continue toward the next key levels.
🔹 Bullish Scenario: A bullish divergence on the 1H or 4H timeframe could trigger an upward move, forming new higher highs (HHs) and higher lows (HLs).
Trade Setup:
🔹 Short Position: If price stays below resistance & rejection continues.
🔹 Long Position: If bullish divergence confirms & price reclaims lost levels.
Big Move Expected – Watch Closely!
What’s Your Bias? Bullish or Bearish? Comment Below!
#XRP #Crypto #Trading #HarmonicPattern #TechnicalAnalysis #CryptoTrading

XRP/USDT 1H: Strong Bearish Momentum – Wait for Reversal ConfirmXRP/USDT 1H: Strong Bearish Momentum – Wait for Reversal Confirmation?"
🚀 Follow me on TradingView if you respect our charts! 📈 Daily updates!
Current Market Structure:
Price at $2.37 with strong bearish momentum.
Clearly defined bearish structure with lower highs and lower lows.
Market Maker Activity:
Market makers distributed heavily in the $2.70-2.80 zone.
Multiple bearish order blocks are visible on the descent.
RSI shows oversold conditions but lacks bullish divergence at this time.
Key Levels:
Major Resistance: $2.60 (previous support turned resistance).
Immediate Resistance: $2.45.
Current Support: $2.35.
Next Support: $2.30.
Trade Setup (Confidence 8/10):
Recommendation:
Wait for reversal confirmation before taking a long position.
Look for a double bottom formation or a bullish order block as a signal.
Potential long entry may be considered after reclaiming $2.45 with tight stops.
Risk Score:
8/10 – High-risk environment, given the strong bearish structure.
🚀 Follow me on TradingView if you respect our charts! 📈 Daily updates!

IF YOU ARE A NEW TRADER YOU HAVE TO SEE THIS VIDEO!!!In this video we explain you everything about the crypto market and how it operates!
We explain you why you are liquidated multiple times and much more!
Very important informations have been finally revealed!
This video will help you to adapt new mentality and strategy which will help you to take right decisions in the future!
This video will help you to finally become profitable!
Trade safe

XRP- TA was given days ago. BeautifulXRP- TA was given days ago. Beautiful.
i cant paste images (TA and chart) from another source here, unfortunately :(
longed from local daily to local daily . 8.5 % 🎯👌
next possible POIs are marked. We are gonna do TA at those level again. Think dynamically ;)
🔔Follow for more ideas/Signals.
Just donate some of your profit to Animal rights and rescue or other charity :)✌️

XRP bullish pattern#XRP made a triangle whith 5 waves i think that this coin is targeted the supply zone in higher prices you can make a long position with 5X leverage

XRPUSDT pullback rejection from Resistance Level
here is my short analysis about XRPUSDT we may see a pullback again from resistance, consider this analysis on technical insights we will rejection target is to move around 25k.
please support me like and comment on this analysis and thanks 🙂

xrp sell limit midterm"🌟 Welcome to Golden Candle! 🌟
We're a team of 📈 passionate traders 📉 who love sharing our 🔍 technical analysis insights 🔎 with the TradingView community. 🌎
Our goal is to provide 💡 valuable perspectives 💡 on market trends and patterns, but 🚫 please note that our analyses are not intended as buy or sell recommendations. 🚫
Instead, they reflect our own 💭 personal attitudes and thoughts. 💭
Follow along and 📚 learn 📚 from our analyses! 📊💡"

Follow up #1: Bullish Hidden Divergence on XRP - 4H TF ChartEvidently,
1. The Hidden Divergence in teh 4H TF Chart failed:
it is reflected by the 2 purple arrows and it did not work out this time.
Had a wide SL and Got stopped out below the forming Wedge.
2. The 4H TF Chart looks normal now:
Price goes down making a lower lows, OBV does the same (Blue arrows in 4H TF))
3. Now What?
The same blue arrows BUT in the 1H TF show a forming Regular Divergence.
SO Wait and see if:
- the zone of interest/liquidity zone around $2.30 holds
- wait for the Sweep to complete (OR TAKE YOUR CHANCE aournf $2.30) with the move back up creating a Regular Divergence (a Lower Low for price BUT a Higher Low for OBV i n the 1H TF )
That is another chance to get in Long
PS: I took my chance.......... I will create a follow up #2

XRP's Battle for #2: Is $14 the Next Target?I’m starting to build a position on CRYPTOCAP:XRP below $2.10.
There is a topping pattern with a chance of continuation down below $2, but as long as $2 holds, the pattern has not yet fully developed.
I also like the strength XRP has shown, especially when most coins are making new lows. We can’t overlook the fact that this coin has had a multi-month breakout. Even if it invalidates my position here, I will continue to look for opportunities as long as BTC stays above $75K.
I’m aiming for above $14 😊, even though it seems far off, as the quarterly signal is still active. BINANCE:XRPUSDT

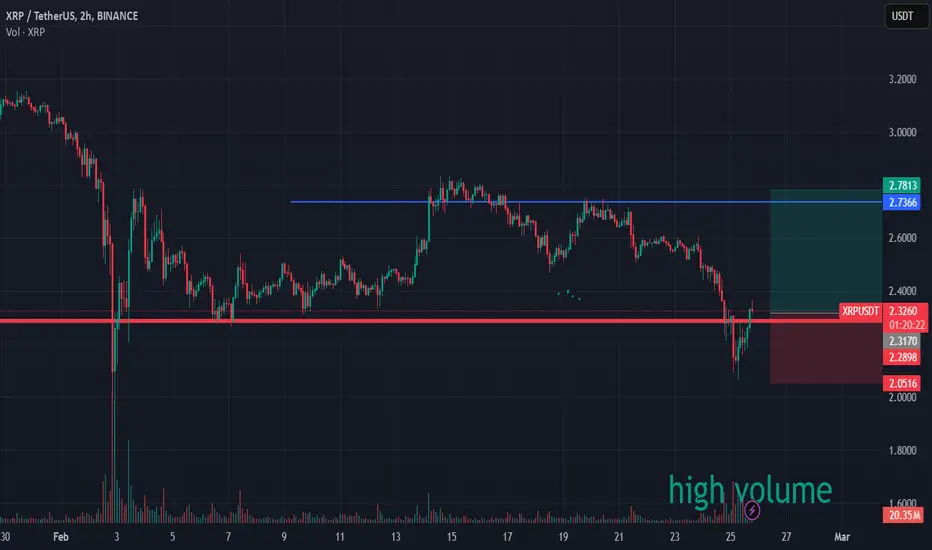
XRP within an area of high probability of risingHigh volume in a bull trap in XRPUSD, nice entry for buying, and recover the loss you had in Solana or ETH or BTC, hahhaha
Follow up #2 Bullish Hidden Divergence on XRP 4H TF ChartHello ALL,
PS: ALT COINS SEASON ALWAYS STARTED IN FEBRUARY IN THE PAST SO IT IS WORTH BEING STOPPED OUT A FEW TIMES BEFORE IT STICKS !!!!
I Took the Bullish Hidden Divergence -> STOPPED OUT
I Took my chance on the Liquidity Sweep at $2.30 -> STOPPED OUT
Now What ?
I looked for clues in all the Time Frames. It has to be somewhere and Here is what I found:
- 1W TF Chart offers 1 clue:
The trend Channel in the weekly chart is evident if you draw the bottom line of that channel based on the top line that has already formed. (Yellow Lines).
The low of of Tuesday morning touched that line at $2.06-2.10
- 3H TF Chart offers another clue:
LIQUIDITY SWEEP DOJI when price touched the bottom trend line (DOJI 1)
So here is what I did:
I waited for a second bottom after that DOJI 1 and here is what happened:
1. 3H TF Chart: A Bullish Hidden Divergence between PRICE and OBV (Blue arrows) started to form
2. 10M TF Chart: A regular Bullish Divergence between Price an dOBV formed.
I took my chance and I entered LONG around there.
It turns out:
- It was the low of the day so the 10M TF Chart Divergence did not lie.
- a nice LIQUIDITY SWEEP DOJI in 3H TF Chart on the low of the day creating the Hidden Divergence (DOJI 2)
So let’s see what happens !
Thanks for following

XRP to the moon ?We are in a situation where XRP is poised to rise again, potentially reaching $3.25. This expectation arises because the 15-minute Fibonacci resistance level has been broken with a strong candle.


XRP/USDT 1H: Bullish Recovery in Play – Next Resistance $2.75??!XRP/USDT 1H: Bullish Recovery in Play – Next Key Resistance $2.75?
🚀 Follow me on TradingView if you respect our charts! 📈 Daily updates!
Current Market Condition:
Price at $2.67 showing bullish momentum with a strong recovery from $2.50 support.
Market structure indicates the accumulation phase is complete, entering a markup phase.
Smart Money Analysis:
MM accumulation visible in the $2.50-2.55 zone.
Hidden bullish divergence on RSI confirms underlying strength.
Volume increasing on recent green candles.
Institutional buying pressure evident from OB fills.
Trade Setup (Confidence 8/10):
Entry: $2.67-2.70 zone.
Targets:
T1: $2.80
T2: $2.85
Stop Loss: $2.58 (below recent swing low).
Risk Score:
7/10 – Favorable risk-to-reward with a clear stop loss level.
Recommendation:
Long positions are recommended with tight stops. Watch $2.75 as key resistance.
🚀 Follow me on TradingView if you respect our charts! 📈 Daily updates!

XrpusdtBearish prize rejected multiple 2.80
Revisit its recent support 2.35 if it’s not sustain
Go further strong level 2.05

Leading diagonalAs we did not get a push up to ~3$ it's starting to look like a leading diagonal(3-3-3-3-3). Looks like we will be moving sideways for a little bit longer.

XRP USDT ( Ripple Analyse )I'm thrilled to share a new analysis for XRPUSDT. Currently trading around the $0.5180 area, XRP is exhibiting a Bullish Shark Pattern on the chart, indicating a potential bounce from this level.
Our projections for XRP are as follows:
Target 1 (TP1): $0.5950 (15% potential gain)
Target 2 (TP2): $0.65 (25% potential gain)
Target 3 (TP3): $0.82 (58% potential gain)
These targets are considered mid to long-term objectives. The chart indicates a 4-day timeframe, suggesting a patient approach.
We've initiated our position in XRP from this zone and will keep you updated on further developments.
Wishing everyone profitable days ahead!

XRP - Same chart Still rolling in XRP, I like the hype, strength, and retail demand on this one, XLM is also a sleeper here.
Watching that $2 area if I can load a bag, my target is $4.
Own long term in exchange, Trade short term in Robinhood, DCA and dump.
Not financial advice, GTLA

XRP - Time to buy again!The price has formed a Triangle on the 4h time frame, and if it breaks out, it can drive the price up to around $2.7.
Give me some energy !!
✨We spend hours finding potential opportunities and writing useful ideas, we would be happy if you support us.
Best regards CobraVanguard.💚
_ _ _ _ __ _ _ _ _ _ _ _ _ _ _ _ _ _ _ _ _ _ _ _ _ _ _ _ _ _ _ _
✅Thank you, and for more ideas, hit ❤️Like❤️ and 🌟Follow🌟!
⚠️Things can change...
The markets are always changing and even with all these signals, the market changes tend to be strong and fast!!

$XRP⏰ CRYPTOCAP:XRP Outlook 2.18.25
Currently 2:00 pm est. seems we are failing $2.52 FVG and will head lower towards our support level $2.42.
