XRP - Descending TriangleFormed a descending triangle, the price broke through the support on the daily TF and consolidated. The target for the decline is $1.6
XRPUSDT.P trade ideas

25.12.2024: XRP/USDT – Consolidation or Breakout?📊🚀 What’s Next for XRP? Let’s Analyze!
Key Levels to Watch
🔼 Resistance:
$2.40 (0.786 Fibonacci): Immediate resistance. A breakout above this could target higher levels like $2.65–$2.93.
$2.93 (1.0 Fibonacci Extension): The swing high and ultimate bullish target for continuation.
$3.00: Psychological level
🔽 Support:
$2.06–$2.00 (0.618 Fibonacci): Critical and support zone. A breakdown here could start a fall towards $1.68 (0.5 Fibonacci).
$1.98 (Psychological Level): Aligns with prior rejections and forms the lower consolidation boundary.|
Current Observations
📈 Trend Overview:
Price is consolidating between 0.618 ($2.00) and 0.786 ($2.40) Fibonacci levels.
EMAs reflect indecision: Price is sandwiched between the 20 EMA (orange) and 50 EMA (blue), but 100 EMA and 200 EMA are sloping upward, indicating a bullish trend on higher timeframes.
📊 Indicators:
RSI: Neutral (~50), signaling no strong momentum yet. Watch for a breakout above 60 for bullish confirmation or below 40 for bearish momentum.
Volume: Decreasing during consolidation, signaling potential buildup for a larger move.
Trade Scenarios
💹 Bullish Setup:
Entry: On breakout above $2.40 with strong volume.
Stop-Loss: Below $2.30 (to avoid false breakouts).
Take-Profit:
First target: $2.65
Second target: $2.93
📉 Bearish Setup:
Entry: On breakdown below $2.00 (0.618 Fibonacci).
Stop-Loss: Above $2.10.
Take-Profit:
First target: $1.68 (0.5 Fibonacci).
Second target: $1.39 (0.382 Fibonacci).
Summary
XRP is currnelty consolidating. Bulls need a breakout above $2.40 for further grow to $3.00, while bears could take over, if the price breaks below $2.00.
P.s. Whales are buying XRP:
25.12.2024 - price is 2.29 and 5.07B buying.
vs 03.12.2024 - price is 2.87 and approx. 4.67B buying.
Are you bullish or bearish on XRP? Share your vision in comments ;)

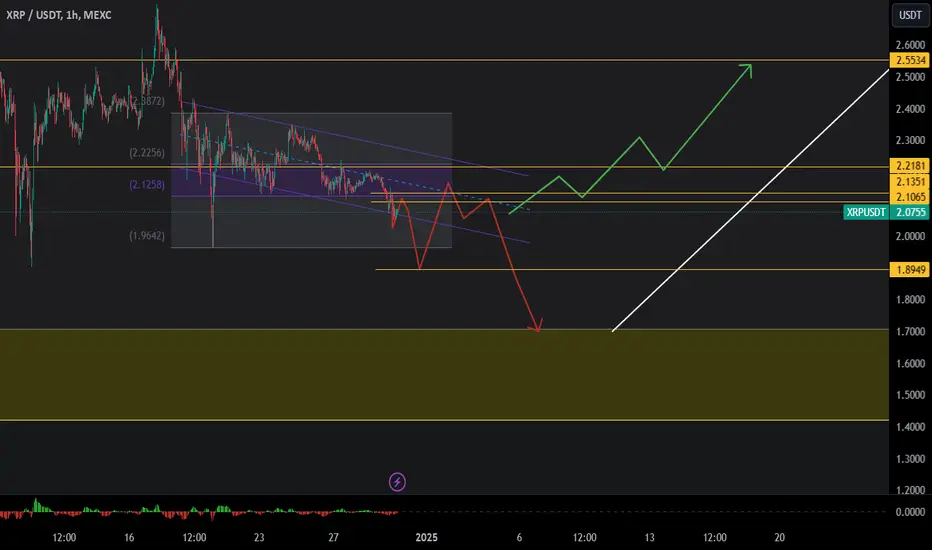
xrp update 1 hourupdate xrp usdt 1 hour chart
dont overpower the trade en look what the price action tells
have a nice day!
Disclaimer: Think carefully before making an investment and never invest more than you could afford to lose. We at legendsoffcrypto do not provide financial advice and are not responsible for any financial loss. The content we offer has purely entertaining and educational value.
XRP Buy the incoming dump (1.42 $)I'm expecting a huge dump in crypto market in the upcoming days, and I believe it's the best time to buy since I'm I believe the trend is too powerful to end now.
Place your buy orders on 1.42 $ which is a very strong level in my opinion: Daily order block + 61.8 fibbo level.

Analysis of XRP/USDT Chart:Analysis of XRP/USDT Chart:
Key Observations:
Current Trend:
The chart shows a retracement phase after a significant rally, consolidating within a range between $2.00–$2.40.
Lower highs and retests of order blocks suggest cautious bullish sentiment, with potential for further downside before continuation.
Key Technical Zones:
Bullish Order Block (OB):
Around $2.10–$2.13: This zone aligns with a discount price range and has previously acted as a strong demand area. Likely to attract buyers again.
Bearish Order Block (OB):
Around $2.40–$2.70: This resistance zone suggests strong supply pressure. For upside continuation, price needs a decisive break above this level.
Fair Value Gap (FVG):
There is a gap around $2.15–$2.20, indicating inefficiency in price action. This could be a magnet for price to revisit and fill before further movement.
Fibonacci Retracement Levels:
The retracement aligns with key levels:
50% Level: Around $2.15.
61.8% Level: Around $2.00, coinciding with structural support and a bullish OB.
Possible Entries:
1. Bullish Entries:
Zone: $2.10–$2.13 (Bullish OB):
Look for bullish price action confirmation (e.g., rejection candles or a strong rally) at this level.
Stop Loss: Below $2.00 (to avoid false breaks).
Target 1: $2.40 (Bearish OB resistance).
Target 2: $2.70 (next resistance).
Zone: $2.00–$2.05 (Deep Discount Zone):
If price overshoots the OB, this deeper zone aligns with the 61.8% Fib retracement and prior structural lows.
High-probability entry for long trades.
2. Bearish Entries:
Zone: $2.40–$2.70 (Bearish OB):
Look for bearish confirmations, such as rejection patterns, to short from resistance.
Stop Loss: Above $2.70.
Target 1: $2.15.
Target 2: $2.00.
Probability Scenarios:
Bullish Continuation:
If price holds above $2.10, a breakout above $2.40 is likely. This could lead to a rally toward the next significant resistance at $2.70–$3.00.
Probability: Medium (Requires bullish macro catalysts).
Bearish Retracement:
If price breaks below $2.10, expect a deeper retracement toward $2.00 or lower, aligning with Fibonacci support and prior OBs.
Probability: Medium-High (If market sentiment or macro factors remain weak).
Range Consolidation:
If price remains between $2.10–$2.40, consolidation could continue until a breakout is triggered by macro or technical factors.
Probability: High (Current structure suggests indecision).
Macro and Sentiment Drivers:
Market Sentiment:
Bullish sentiment in the crypto space (e.g., Bitcoin rally) will likely support XRP's upward movement.
Negative sentiment, such as SEC-related developments or broader market corrections, could drive XRP lower.
Regulatory News:
Any updates on Ripple's legal battles (e.g., SEC cases) will strongly impact price.
Adoption and Partnerships:
Positive news about Ripple’s adoption by financial institutions or cross-border payment networks could boost price.
Broader Crypto Market:
Watch Bitcoin dominance and altcoin performance. XRP tends to follow broader market trends during strong bullish or bearish phases.
Recommendation:
Bullish Bias:
Enter at $2.10–$2.13 or $2.00–$2.05 with a tight stop loss and targets near resistance zones.
Bearish Bias:
Look for rejections at $2.40–$2.70 to short with targets near $2.15 or $2.00.


Xrp long termXrp for the long term support levels level 1 1.8486
Level 2 1.6759
And de last one must hold is Level 1.3058
The levels to gain Level 2.2003
The level to gain for the moonshot Level 2.6629
Disclaimer: Think carefully before making an investment and never invest more than you could afford to lose. We at legendsoffcrypto do not provide financial advice and are not responsible for any financial loss. The content we offer has purely entertaining and educational value.

XRP Long 1$- Price just took out the High and drove FOMO buyers into buying a potential breakout.
- With price dumping afterwards all stops have been ran and price does came back into the initial CISD level.
- This is the optimal long trade entry level with market being in total fear right now.
Take care and good luck.

Will history repeat itself? Somehow found this pattern oddly similar to the November pump. and looking back, its building up to something. ;)

XRP Short-terma huge drop is coming
A significant short-term drop in XRP is likely as the market opens. Proceed with caution.

XRPUSDT 1WXRP Update ~ 1W
#XRP So far it continues to maintain its bullish structure. This is Wave 2 of the correction. Buy gradually within this support Block,. for wave 3 of the next increase.

XRPUSD Chart Analysis: Key Patterns and Price PredictionsHere’s a complete list of patterns and observations of what I see in the chart:
1. Symmetrical Triangle (Current Pattern):
• The price is consolidating with lower highs and higher lows, forming a symmetrical triangle. This is typically a continuation pattern, and given the prior uptrend, an upward breakout is more likely.
2. Ascending Channel (Previous Trend):
• Before the current consolidation, the price exhibited higher highs and higher lows, forming an ascending channel that indicates a strong bullish momentum.
3. Double Top Potential:
• The chart shows a possible double top forming near the resistance zone of $2.25. If the neckline (support level) breaks, it could signal a bearish reversal.
4. Bullish Flag (Earlier in the Uptrend):
• Earlier in the trend, there’s a sharp upward movement followed by a slight pullback in a parallel channel, forming a bullish flag, which is a continuation pattern.
5. Golden Cross (EMA Crossover):
• The EMA 55 (yellow line) crossing above the EMA 144 (blue line) earlier in the trend suggests a golden cross, a strong bullish signal.
6. Support and Resistance Levels:
• Key resistance is visible at $2.25, while support is around $2.10. These levels are crucial for determining whether the price will break out upward or downward.
These patterns provide a detailed picture of XRP’s current and prior price actions, highlighting both bullish and bearish possibilities based on key levels and formations.

XRPUSD Chart Analysis: Identifying the Current PatternBased on the chart you’ve provided, the price appears to be consolidating in a sideways movement, forming a symmetrical triangle pattern or pennant pattern. This is characterized by converging trendlines with lower highs and higher lows.
Key Observations:
1.Trend Before the Pattern: There was a strong upward trend leading into the consolidation, which supports the possibility of a continuation pattern.
2.Converging Lines: The highs and lows are narrowing, forming the triangle shape.
3.Volume Decrease: If volume is decreasing during this consolidation phase (not visible in the chart but typically happens), it further supports the pattern.
Outcome:
Breakout Direction: Symmetrical triangles are neutral patterns, so the breakout can occur in either direction. However, since this follows an uptrend, the probability leans toward an upward breakout (continuation of the trend).
Key Levels to Watch: The breakout above the resistance line or below the support line will confirm the next move.
If you want a more specific analysis or further details about this formation, let me know!
Can’t wait to find out soon! What do you think? 🤔

Price PredictionI painted the first fib retrace and subtracted about 1% from the 2.618 line and it was 4.444 I subtracted another 1% to start the next fib retrace, then another 1% of of that 2.618. this is how I normally calculate when to pull out and it blew me away that the final number came to the legendary $5.89 number.


Strong supportIf the support below not breached, then it will go up. if the support breached, then it will deep.

XRP/USDT: Preparing for the Next ImpulseMarkets move in cycles of Impulse ➡️ Correction ➡️ Impulse, and XRP is no exception. Since December 3, we’ve been in a correction phase, consolidating after the recent strong rally.
The structure is tightening, and the market is “cooking” something interesting. Watch for potential breakouts as we approach the next impulse phase.
📊 Let’s see how this unfolds—stay sharp and ready!
#CryptoAnalysis #XRP #TradingView

Wave 4There is no need to explain anymore. We are passing wave 4. It can move up to the yellow box and then launch to the moon.

XRP and what is actually happening Despite the widespread optimism and enthusiastic support for XRP on social media, the broader picture reveals a more nuanced and potentially precarious situation. Social media platforms often amplify sentiments that may not align with underlying market conditions, creating an echo chamber of bullish sentiment. This optimism can be misleading, especially when it fails to account for actual market dynamics like volume trends, liquidity constraints, or institutional participation.
A key factor complicating XRP's trajectory is the persistent selling pressure that offsets or even eclipses buying pressure. While social media narratives might suggest strong demand, on-chain data and order book analysis often reveal heavy selling activity. This dynamic suggests that market participants, including whales or early investors, could be offloading their holdings during price rallies, limiting upward momentum. Such consistent selling pressure acts as a ceiling for price appreciation and undermines the ability of XRP to achieve sustained breakouts. This indicates that the bullish consensus may be fragile, relying more on sentiment than market mechanics.
The potential for a short squeeze could further complicates the situation. However, selling pressure zeroing out buying pressure could indicate that short sellers have taken aggressive positions against XRP, expecting further price declines. However, this also creates a precarious balance. If buying pressure suddenly spikes due to a catalyst. While this might seem bullish, short squeezes are often temporary and highly volatile, leaving prices vulnerable to retracement once the squeeze subsides. It’s a double-edged sword that could momentarily align with the social media hype but fails to establish long-term stability.
Example in the H4 time frame based on XRP:USDT.P
Short explanation:
1) The main pane shows the price action. We can clearly see in the 4 hours time frame a majority of supply rather than a strong demand action (based on LL HL and retracement)
2) the choppiness level of the market seems to be quite persistent, indicating a clear consolidation path likely mid term lasting
3) the red line indicates the balance between premium and discount , and as we can see at present , the price is tapping constantly the discount area of support provided by the lower band of supply.
Some consideration about the BULL flag which I should call it BS flag most of the time when is so wide spread. Here the 4H chart for the current wide spread believe that XRP is creating a bull flag:
We can see clearly the choppiness of the market is even better visible adding the so called bullish triangle to the actual current price trend which will see some action between the new year eave and the 9th of January 2025:
In short, if you are an XRP holder spot just keep it , if you are trying to get the so called breakout be aware that market makers know how many retail traders are trying to jump into this high level of choppiness because over leverage is actually visible. Actually as an indicator when you have a good way to identify choppiness in the market , means that we should expect some sort of action soon the choppiness reached its peak. For this I wrote an indicator that you can see in my charts.
Price entries for buy :
Around 2.150 if does not break the demand zone below (always at least 3 candles confirmation in 3 different time frames)
If the demand zone is breached around that zone next one should be around 1.9500 and 1.90 . In between there are also several gaps to be covered so we could also expect a short squeeze and also an array of orders to sweep buy stop losses too.

$XRP - Short To Long Term Trade PossibilityBINANCE:XRPUSDT - This is how i reckon XRP play out. Short term target of $2.70-$2.80 for now from this particular area zone, followed by some pullback and then going head strong to break above $2.80. For now there can be a 30% profit probability. All the best

Xrpusd pattern breakoutXrpusd broke through resistance of the chart pattern on the 15min. 30pip stop loss with a 60pip take profit giving RR 2:1

Xrpusd pattern breakoutXrpusd broke through resistance of the chart pattern on the 15min. 30pip stop loss with a 60pip take profit giving RR 2:1

XRP 8X Leveraged Trade ExplainedWe are not there yet we our next leveraged trade for XRPUSDT. The truth is that one wave ended recently and there is always a period of rest between one wave and another. A trading range is established and the lower boundary tends to fail before the next wave. Let me explain.
If the support is set at $1.96, this support can hold as XRP consolidates (sideways). At one point, normally before the start of the next advance, there is a drop below support (support breaks). This drop tends to activate all the stop-loss orders and liquidate over-leveraged traders. After this event is complete, we see the development of a new bullish move.
The arrows on the chart are for illustration only. They depict several variations in which this scenario can develop.
The first impulse ended early December. Then comes the consolidation phase. A period of rest to consolidate all this growth the market experienced.
This consolidation phase can last between 1-3 months. We are thinking around three months based on the Mars retrograde, but this varies wildly between markets and pairs. So instead of focusing on a specific time we focus on the price.
The next advance can take XRPUSDT beyond $4.
We wait patiently, there is always a long rest period between a strong advance and the next leg-up. We are in that period now and XRPUSDT has been sideways for 23 days so far.
The red arrow better illustrates my point. Whenever the major drop is in, that's the signal to go LONG.
Before the drop is in, the market will continue to go sideways and this is when leveraged traders lose the most.
Ignore the SHORT side because the market is bullish.
Thanks a lot for your continued support.
Namaste.
