XRP | The chart always reflects positive news or rumors.On the weekly timeframe, XRP is showing abnormal strength and is preparing for a new historical breakthrough.
With the many positive news and rumors swirling around it, I expect significant increases that may reach 2x soon.
Divide your entry into two parts: the current price and the price marked in blue.
TPs are in green.
XRPUSDT.P trade ideas

Xrp to 1.68/1.80Hello this is my thoughts on xrp in couple days
Xrp still very bullish
Do not sell ur xrp

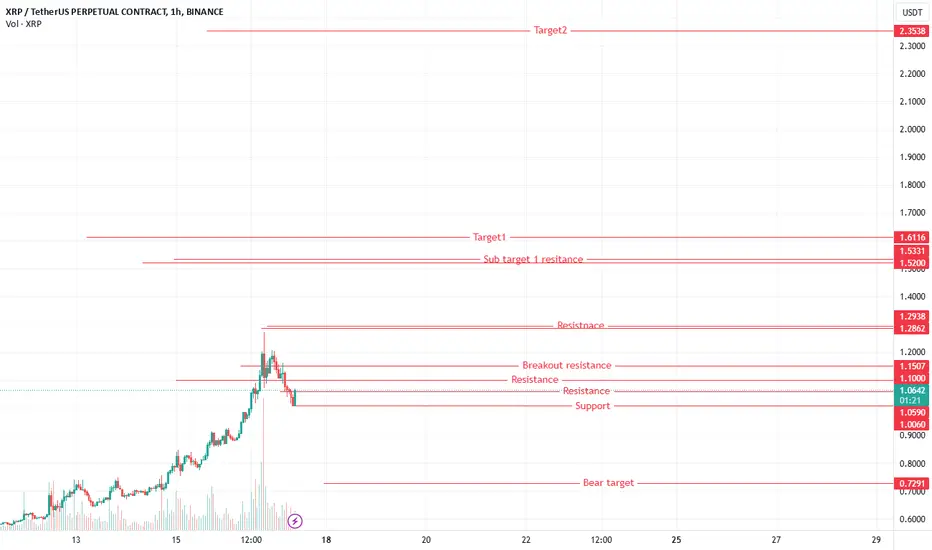
Xrp chartXrp chart key levels.
Each level can reject to a new low. Ideally is the price to stay above the breakout resistance.
Technical Analysis : $XRP/USDTTechnical Analysis : $XRP/USDT
$XRP/USDT analysis shows potential bullish opportunities based on current trends and key levels.
Key support levels : $0.7941 $0.9272
Targets : $1.6569 (80%) $2.0374 (120%) $2.4169 (160%).

Xrp chartXrp chart. Key levels.
Each level can reject to a new low. For the bullish scenario the levels will become support.

XRP Short Term Price TargetIf you haven`t bought the dip on XRP:
Now you need to know that Ripple’s XRP is showing bullish potential, buoyed by its partial legal victory in July 2023. The court's ruling that only institutional sales of XRP were unregistered securities offerings, while programmatic sales to retail investors were not, has given the token a significant boost in confidence. This ruling marks a crucial milestone for Ripple, alleviating some of the regulatory uncertainty surrounding XRP in the retail market.
One factor that adds further optimism is the slow nature of the appeals process. With any higher court ruling unlikely before 2025 and a potential Supreme Court decision not expected until 2026 or beyond, Ripple has time to build momentum and solidify its market position.
From a technical perspective, XRP has been forming higher lows, suggesting a strong bullish trendline. With this upward momentum in play, I expect XRP to target $0.64 in the short term. As regulatory clarity continues to develop, XRP could be poised for further growth in the broader crypto landscape.

XRP $0.5461 Long! Anomalous Point on the Chart!🤖🔥🚀 An anomalous point has been detected on the XRP chart!
🔥 The chart shows a nice squeeze towards a level formed by a Limit Seller.
🚀 XRP $0.5461 Long!
Entry model: Breakout
First target: $0.5738
Second target: $0.6072
💡 XRP is a low-volatility coin with high volume. Leverage no more than 20x-50x!
Short stop-loss.

XRP Accumulation Poised for Breakout: Is a surge to $ incoming?
XRP has been consolidating within a clear accumulation range on the weekly chart, signaling a period of quiet buildup before a potential move. As the broader crypto market experiences renewed bullish momentum—especially with Bitcoin pumping due to the Fed’s recent 50 basis point rate cut—XRP appears ready to break free from its range and head towards higher prices.
Current Market Overview
At present, XRP is trading at $0.58 USD, maintaining this level while consolidating for weeks. This steady accumulation phase often precedes a breakout, where prices tend to surge as market interest picks up. As more liquidity flows into the crypto market, XRP looks primed for an upward push.
Why XRP Is Ready for a Breakout
Weekly Accumulation Phase: XRP’s prolonged accumulation on the weekly chart shows that market participants have been steadily building positions without significant price movement. This type of consolidation typically leads to an explosive breakout once buying pressure outweighs selling activity.
Macroeconomic Tailwinds: The recent 50 basis point rate cut by the Fed has injected fresh liquidity into financial markets, pushing investors toward risk assets like cryptocurrencies. As traditional assets, such as bonds and savings, offer lower yields due to the rate cut, many are seeking higher returns in assets like XRP. This macroeconomic shift provides a favorable backdrop for altcoins, and XRP stands to benefit from this influx of capital.
XRP’s Position in the Market: XRP remains one of the top cryptocurrencies, with strong community backing and real-world use cases, particularly in the realm of cross-border payments. Its utility continues to drive interest from institutional players, which could amplify demand as the market becomes more bullish.
Price Target: $1.10 USD
Given the combination of factors—XRP's extended accumulation phase, the favorable macroeconomic environment, and increasing interest from both retail and institutional investors—I'm expecting XRP to break out of its current range and begin an upward move toward $1.10 USD.
This would represent a significant jump from its current price of $0.58 USD, nearly 90% higher, which is realistic for a coin like XRP once it escapes its accumulation zone and capitalizes on broader market momentum.
Final Thoughts
XRP is on the cusp of a breakout. With market conditions turning more favorable following the Fed's decision and the crypto space heating up, XRP’s accumulation phase could soon end, triggering a strong upward move. A price target of $1.10 USD looks achievable as XRP positions itself for a potential surge.
Stay tuned, as this move could happen sooner than expected.
Disclaimer:
The content provided in this blog is for informational purposes only and should not be considered financial, investment, or trading advice. The opinions expressed are those of Lord MEDZ and do not guarantee any specific outcome. Cryptocurrency investments are highly volatile and risky, and past performance does not indicate future results. Always conduct your own research, assess your risk tolerance, and consult with a financial advisor before making any investment decisions. The author assumes no responsibility for any financial losses or gains that may occur as a result of this information.
Lord MEDZ

XRPUSDT Secondary trend (part) 01 07 2024🟡 Logarithm. Time frame 3 days. Everything is the same as before, nothing new. I’m making a fresh idea, for the convenience of monitoring, how this scale of work is about I did it years ago, and for this there were a lot of local updates.
🟡 Line graph for visualization.
🟣 Local trend. Important breakout zone in scale.
🔵 Main trend
XRP/USD Main trend 2022
🔵 Main , part (this zone that has now been realized on the long-term consolidation chart).
XRP/USD Main trend (part) Triangle 2022
Part of the main trend (huge triangle) and this channel in it before the outcome. The main long-term trend reversal zones and percentages from this zone (relatively where we are now) are shown on the chart. The takeaway percentage is not shown here (a probability that needs to be kept in mind.
Previously, at the beginning of 2017, on XRP before the pump, more than + 65,000% - 55,000% did this (low liquidity). Previously, I showed and told the potential logical probabilities of cheating with something similar near reversal zones and how not only to protect yourself, but also to make money if something similar happens at the moment. I am not scaring, but simply reminding sectarians of the future, which naturally may not exist, but the probability always remains, for certain previously stated reasons.
🟣 For local and medium-term trading a good entry point for breaking the local trend (downward channel) can now be realized.
Control of risks, and understanding of potential work (variants of price movement, and what you will do in this or that outcome of probability) gives you an advantage over those who want to guess the price. Don't guess, but understand what you are doing and why. To make money systematically in (any) conditional markets, you don’t need to constantly guess the price. You may be wrong (your option is B), and that's okay.
🟠XRP to Bitcoin is the main trend.
XRP/BTC Main trend. Channel. Turning zones 03/15/2024

RIPPLE (XRPUSDT): Delivers 1000% Profit!Ripple's daily chart showcases a textbook long trade setup that has achieved stellar results, securing all profit targets.
Traders leveraging a 10x position have seen their capital multiply by 10x, with Ripple surging to a current price of $1.1215.
Trade Recap:
Entry Point: $0.5537
Stop Loss: $0.5197 (minimal downside risk)
Profit Targets:
TP1: $0.5956 ✅
TP2: $0.6635 ✅
TP3: $0.7314 ✅
TP4: $0.7733 ✅
Key Observations:
Massive Momentum: The daily candle pattern and exponential price action reflect heightened market optimism for Ripple, likely fueled by broader crypto market sentiment or Ripple-related developments.
Indicator Support: The Risological Indicator identified a clear upward trend early, providing high-confidence entry signals.
Leverage Amplification: With 10x leverage, traders achieved 1000% gains as Ripple not only met but significantly exceeded all profit targets.
Future Outlook:
Ripple’s ongoing surge positions it as a standout performer in the crypto market. At $1.1215, it remains a market favorite, and traders should monitor closely for potential pullbacks or consolidation for future entries.
Congratulations to all traders who caught this massive breakout! 🚀

XRP D UpdateBlack wave 2 ended up being a flat correction (blue ABC), and we're now in the wave 3 pump.
The 1.1-1.3 zone could offer resistance (dating from 2021) for the end of this wave and start of black 4 correction.
RSI is waaay overbought, so I'll wait for pullbacks before looking for long trades.

XRP: ATTENTION ARMIESWhat XRP need to do now is to stay above $0.6888 to achieve its previous high about $1.00 in time to come.


XRPXRP is currently trading around $1 after breaking key resistance levels, supported by strong buying momentum. Analysts suggest that sustained movement above $0.66 could trigger further bullish momentum, with targets at $1.28 or $2. Key factors include adoption by financial institutions for cross-border payments and potential regulatory clarity benefiting Ripple. Watch for trading volume to confirm any breakout

Amazing Opportunity to long1.16 minimum target with risk reward ratio of 1:7 .. Lets see how this works...I am pretty confident. Remember risk management is key
NFA

My plans regarding xrpWith Bitcoin hitting new ATHs we see some momentum building up in XRP. Last cycle when Bitcoin crossed it's ATH XRP exploded by something around 170%. May not happen so quickly again but the charts are pointing to more upside.
Presenting the chart and a trade idea that displays a position that i'm in already. Got a slightly better entry with over 2 cents in profit at the time of writing it.
I think that the recent drop to 0.5386 could've been the last correction move before a long term breakout to the upside. Even with this entry R/R ratio is at 1:2 so it is a trade that's worth taking from this perspective. Personally I'm hoping for a greater move that will potentially push XRP above the highs from the last cycle.
With violet colour I've marked the price ranges of XRP that I will be using to take advantage of corrections and breakouts in order to secure the best entries and exits as I'm managing this position.
Good Luck
