XRPWPLS_331B71.USD trade ideas

Xrp - The New +400% Bullish Triangle!Xrp ( CRYPTO:XRPUSD ) is creating another bullish triangle:
Click chart above to see the detailed analysis👆🏻
Despite the recent rally of +300% on Xrp, this crypto coin is still totally bullish. However at the moment, Xrp is starting to reject a quite significant all time high resistance level. We could see another drop lower from here before bulls will take over again and eventually create new highs.
Levels to watch: $2.0, $10.0
Keep your long term vision,
Philip (BasicTrading)

XRP USD Price Rebound from HH: Preparing for a Buy OpportunityThe price is in an uptrend and has bounced off the HH on the 1-hour timeframe. We can now expect a continuation in the buy direction, with the target set on a higher timeframe. Entry can be made now, after the bounce from the current HH, or we can wait for a bounce from the next HH. It's essential to wait for proper confirmation.

The pattern identified in THE XRP BREAKOUT CHART continues...The pattern that I identified in mid-2024, where the price action forms a fair value gap followed by an 8-month candle pattern (3 + 5), and then breaks out on the 8th candle, is playing out exactly as predicted many months ago. This means that if the pattern, which has occurred identically four times thus far, repeats for a 5th consecutive time, we can expect an incredible period of price appreciation following the breakout of the 8th candle in the month of May 2025.
I believe that around mid-April to early May, we will see a 'flash crash' type of liquidity run on the sell-side liquidity before the 8th candle breaks out as predicted.
Prepare to be amazed!
Good luck, and always use a stop loss!

Ripple: Another Dip Ahead?In the opening hours of the new year, XRP made a solid effort to recover from the minor weakness of the past two weeks. While the price surged over 25% between December 30 and the following five days, we classify this brief rally as a temporary counter-move, which should shortly transition into the final sell-off of the corrective magenta wave (4). Once the wave (4) low has been settled, the magenta impulsive wave (5) should break above the resistance at $3.28. However, if the price fails to sustain its next upward move and retreats significantly from this green line, the magenta wave alt. (4) will form another low before paving the way for the next upward impulse. This alternative scenario carries a 35% probability.

Umm PRICE rejecting D1 FlagYaaaawn.
This D1 Flag says hurry up and wait.
Looks like price might want to fill in last weeks rally.
My indicators say lets bust up some weak hands.
A revisit below the flag mid point I would add a bit my holdings.
REMEMBER Being wrong is FINE staying WRONG is NOT.

Ripple Is Still Eyeing All-Time HighsRipple is in strong and impulsive rise after we spotted a bullish break out of a larger weekly bullish triangle pattern. It's actually already at 2.9 area and there can be easily space up to 3.3 all-time highs area. Looking at the 4-hour time frame, we saw a nice extension higher within wave (3), so after current wave (4) correction that can be completed as a nice and clean A-B-C flag pattern with textbook support from 2021 highs, be aware of another push to the upside for (5).
Just in case if Ripple stay sideways for a longer period of time, then we might even consider a bullish triangle pattern in wave (4), but sooner or later we can expect further rally within wave (5) towards all-time highs area.
Why XRP Is higher?
The reason for this push higher on ripple, which has been outperforming in the last few weeks, is the upcoming launch of Ripple USD (RLUSD). Ripple USD (RLUSD) is a new stablecoin aimed at bridging blockchain and traditional finance. "Designed for enterprise use, RLUSD focuses on stability, efficiency, and transparency, enhancing Ripple’s cross-border payments and meeting the demand for USD transactions".

XRP BIAS / MARKET OUTLOOKJust my personal perspective, never take anything I say as financial advice.

XRP To the Mooòon? The squeeze is on!XRP looks ready to rip!
Fasten your seatbelts kids.
The blue shaded area is the daily chart flag sharted a few days ago on here. There really isn't much room for the daily chart to move.
It's now or never this D1 chart is looking ready to me.
Don't forget NO TRADE is a sure bet.
Manage RISK WELL if you want longevity in this game.
HAVE A GREAT WEEK 👌

$XRP Historic Breakout IncomingIn all the years I've been trading cryptocurrency, I've never encountered a bull flag that has been forming for a full seven years. Such a phenomenon is virtually unprecedented and could herald one of the most monumental and historically significant breakouts in the crypto market.
We may be standing on the threshold of an event that will not only attract the attention of the entire financial world, but may also set an entirely new development vector for the entire crypto industry. This pattern is already starting to break through, this could be the moment that changes everything, opening a new era in the world of digital assets.

XRP can able record to $11 this year XRP is very bullish and you see the bullflag and during accumulation.
Earlier today in mind i just posted for all traders to buy XRP inside 2.30 thru 2.35 area.
Trillions and millions even billions filling to XRP and things getting crazy also i can see 3$ first thats the target, its bullish and i see no sign of bearish.
Also XRP need to skyrocket and gain at least 85% to flip Ethereum.

XRP - Bull FlagXRP looks to break out soon. A channel (flag) formed after XRP's uptrend (flag pole), signaling a rally to resistance levels. The Relative Strength Index (RSI) is overbought, signaling a dip before a possible breakout. A dip in the upcoming days will follow the bull flag signal, with market price striking key resistance levels.
Chart - 12hr
Resistance - $2.90
Support - $1.96
F & G Index - 61 Greed

Diversion to Bullflag!First-hand we had similar set-ups for a new run to the upside based on previous patterns. Now Xrp has switched patterns slightly to what appears to be a bullflag set-up! And now I'm even more bullish than before in my last chart I did. This is exciting!
Expect this bullflag to be completed January 30th, so that means potentially big moves up before that date! Get ready!! 🚀🚀🚀🚀

Ripple. Updating XRP chart.
It seems like there should be a wave E in this triangle wave 4, before the next one takes XRP to new all time highs. Many points to 4,5-5 target zone, with strong structural logic behind it.

XRPUSD SELL SET UPShort-Term Sell Idea for XRP/USD
XRP/USD is showing bearish signs after rejecting the key resistance.
Price is forming lower highs, signaling potential downside.
Good luck to everyone! 🚀📉

XRPUSD PERFECT TIMEFollowing BTC's SURGE, XRP is looking to bounce back for a short time and consolidate, awaiting Trumps sitting in the WHouse.

XRP's ROADMAP TO SUCCESSWhats up chat i hope you find yourselves well. This is Xrp's roadmap to success i really hope it shoves back down to 2$ for one last opportunity before it goes sharply up to 3$ and past ATH around janurary 20 theres many events from trumps inauguration, to all planets aligning on janurary 25. xrp is bound to go to all time highs by the end of this month so please monitor it very closely were about to shoot up!

xrp call this a make or break stance. there are two points of interest to watch out for. they have been highlighted with purple triangles. the second one at 2.1$ seems to be much farther away from the current point of interest which price is currently testing. there are two ways to take advantage of this . i am adding the 15m chart to this because price is currently at tthe points of interest the circles highlights where price has to close above. before we validate this closest interest area. if it does. it may go further below to sweep liquidity before continuation of the move. im watching xrp closely, you should too

Waves on XRPWe could expect some retracement to the 2.27 supply zone, after that we are ready to ATH.

XRP BuyXRP/USD Trade Idea
Trade Type: Long (Buy)
Potential Entry Zone: $2.25–$2.3
Rationale:
This trade is based on a simple price action analysis, with potential support forming $2.2 - $2.3 level.
Key Notes:
The trade idea does not rely on indicators, focusing solely on price levels and supporting market data.
Risk management will be critical, and traders should adjust stop-loss and position size according to their strategy.
Risk Management:
Define a clear stop-loss level based on your risk tolerance and adjust take-profit levels based on evolving price action.

XRP to $3Price has jus approached my Points of interest and i am to see if price will start making new highs and take out the old ones ....


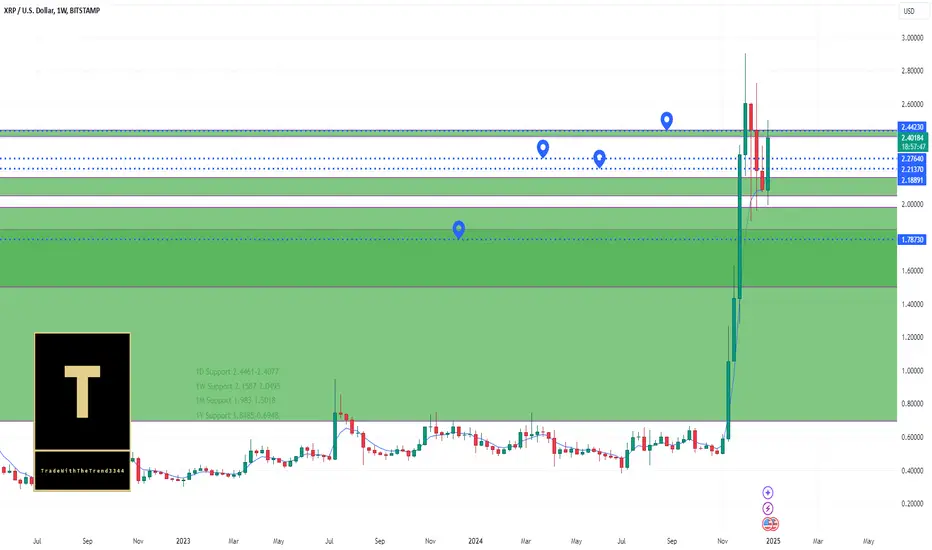
XRPUSD Testing Key Pivot Points Amid Bullish TrendHello,
BITSTAMP:XRPUSD is currently testing the 1D pivot point, and if there's a rejection, the next level to be tested is the 1M pivot point. If that also faces rejection, the 1Y pivot point will likely be the next in line. At the moment, there is significant selling pressure in anticipation of this potential outcome. However, market sentiment has not yet reacted, as traders are awaiting confirmation for either further upward or downward movement. Currently, the trend remains strongly bullish.
No Nonsense. Just Really Good Market Insights. Leave a Boost
TradeWithTheTrend3344