TEZOSTEZOS has broken through the support it has held since 2019, a further decline possible.
Many altcoins will have a similar fate.
XTZBULLUSD trade ideas

Will XTZ reach $1 this year?XTZ Price Analysis: Tezos Eyes $1 With $0.70 Break!
XTZ price action displays a bullish comeback as it rises above the $0.70 mark.
Tezos price breaks above the 50-day EMA and the falling channel pattern.
A bullish closing above the $0.70 mark can shoot XTZ price higher to $1.
Maintaining a downtrend motion for most of 2023, the XTZ price action forms a falling channel pattern in the daily chart. Following the early 2023 gains of around 102%, the downtrend crashed the Tezos market value and crushed the dream of a golden crossover.
Despite the ongoing long-coming bear trend, the recent reversal improves the upcoming Tezos price prediction and signals a buying opportunity.
As the altcoins take a bearish hit, Tezos gives a bullish breakout of the long coming resistance trendline to exit the falling channel. Moreover, the uptrend overcomes the declining 50-day EMA with dominance.
Despite the sharp comeback, the XTZ price is yet to end the lower high formations, but it rises above the $0.70 mark. This signals a range breakout that was between $0.70 and $0.628.
Currently, the Tezos market value is at $0.719 with an intraday gain of 10.49%, leading to a huge bullish engulfing candle. The bullish comeback overcomes a multitude of bearish pitfalls and signals a high possibility of an uptrend.
Technical Indicators:
RSI indicator: The daily RSI line skyrockets to surpass the halfway line and puts a bullish exclamation mark. This reflects a sharp increase in the underlying bullish sentiments.
EMA: The 50-day EMA breakout will increase the chances of the Tezos market value reaching the 200-day EMA.
Will XTZ Price Reach $6.30?
Despite the long coming downfall, the recent consolidation breakout led to various breakout signals. This reflects a sudden increase in positive sentiments around the Tezos and hints at the XTZ price ready to skyrocket in the Uptober rally.
While the bullish candle is yet to give a positive closing, the high spirits of Tezos HODLers anticipate a bull run. With the breakout candle igniting a bullish sprint, the XTZ prices can reclaim the $1 mark shortly.
On the flip side, failure to close above the 50-day EMA, or the broken trendline, or the $0.70 mark can hamper the upside rally. In such a case, the prices may coil back under the falling channel.

XTZUSD Extinct crypto starting to move?Tezos (XTZUSD), a long forgotten market favorite, is posting today the strongest 1D green candle since February 22 2023. This is backed up by a long 1D RSI Bullish Divergence. As long as the 0.6300 Support holds, we expect XTZ to target first the Lower Highs 2 (dashed) trend-line and the 1D MA200 (orange trend-line) and finally the strongest long-term Resistance Cluster, the 1W MA50 (red trend-line) along with the 0.92500 Resistance.
Our target is 0.9000. Notice the similarities between the current mid-2023 Triangle, with that a year ago in 2022. That broke the Support to the downside and extended to the 2.0 Fibonacci level, while the current is breaking above the Triangle. Keep that in mind however, in case the 0.63000 Support breaks.
-------------------------------------------------------------------------------
** Please LIKE 👍, FOLLOW ✅, SHARE 🙌 and COMMENT ✍ if you enjoy this idea! Also share your ideas and charts in the comments section below! This is best way to keep it relevant, support us, keep the content here free and allow the idea to reach as many people as possible. **
-------------------------------------------------------------------------------
💸💸💸💸💸💸
👇 👇 👇 👇 👇 👇


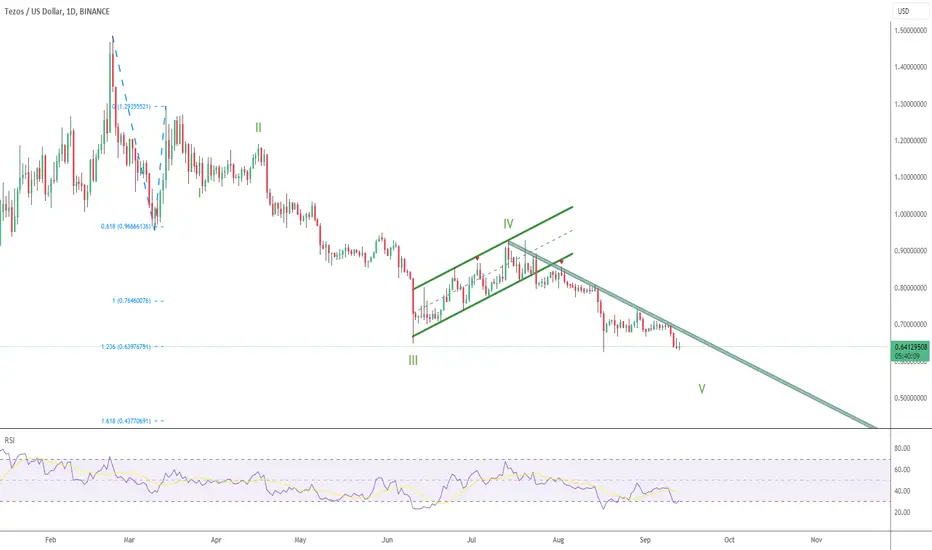
XTZ Wave 5
The broken flag from my previous post led to new lows as expected.
In my primary count, we are already on green wave V, which would soon lead us to bullish price action.
But soon doesn´t mean now... I´m waiting for further price action to see if bulls step in, beginning with a break of the green descending trendline.
XTZUSDT where to buy for a long termLet's take a look at Tezos.
The final capitulation may be just around the corner.
Tezos looks very weak. No buyers .
Downtrend continuation is very likely.
Where to buy? 0,35$ - 0,45 $ seems to be a reasonable price.
Can it go lower? Yes, if the sentiment gets more bearishness on it, Tezos will go lower so you can place some orders at lower prices.
Remember:
Buy low, sell high. You can become rich only if you buy cheap in the bear market. Buying when the price is rising in full bull mode will only get you rekt.
Enjoy and good luck

XTZ In the buy zone. Urgently !!!Global zone 1.067-0.545
Buy level 0.804
Local zone 0.821-0.497
Buy level 0.665
The price is in the zone of sweet purchases 0.845-0.645 and is much lower than the volume price, which amounted to 1.427 for the entire period
I suspect that volume is running up in the global zone! and the price of the volume will move to the level of 0.804, but this is not accurate!!!
Good price to buy!!!
Control zones did not draw (sorry :)))

XTZ - Broken bear flag
The bear flag from my previous post has been broken (see related idea), and we're now consolidating sideways below the lower trendline.
Considering there is still no RSI Divergence on the Daily, there's a high probability that we'll see a lower low soon, below 0.6487.


✴️ Tezos Long-Term Projections (2,700% or 27X New 2024 ATH)Tezos (XTZUSD) has a different chart compared to other Altcoins, which is always a signal of strength. It produces its own patterns.
Looking at VeChain recently, we noticed the last bull market lasted a nice 399 days, from bottom to peak.
Look at Tezos now and see the huge difference, the bottom was hit December 2018 and the peak October 2021, lasting a massive 1036 days, almost 3 times as much as VeChain.
Tezos growth totaled 2,790% (last bull-market), the numbers look very similar right now with a potential All-Time High target of 2,700% (27X) nearing $24, just below this number.
I am using Fibonacci proportions and a method devised by Ralph N. Elliot, the master analysts of all times to extract these numbers.
These are only projections and the real, final numbers can be much lower just as it can be higher.
Thank you for reading.
And remember to like, follow and comment to show your support.
Namaste.

XTZ - Channeling A Way Through Resistance XTZ, as with the rest of the market, is running due to the court catalysts that i've been posting about all month. 🫡
Recently, after the sell off, the price action has been forming a channel uptrend.
I will publish this on the 4 hour and one day so that the price action is easier to track.
In the near term, price is likely to see some profit taking over the next 4-12 hours, and then we'll likely rebound from the support platform to retest the resistance.

Xtz 10x potential growth long Pls 🙏 #DYOR #NFA
In my opinion best buy around $0.24-3
Sell $2-2.8
If breaking wave 4 📍 this article get invalid 📌 which seems correction completed 🚀

XTZ: Bear Flag = Further Downside
As with most cryptos, I´m not convinced by the recent uptrend.
In Tezos´ case, we have a bear flag in play, strengthened by the fact that there is no RSI divergence, which would be expected if the downtrend was over.
Consequently, my outlook remains bearish on Tezos, and I anticipate the possibility of at least one more lower low in the near future.

XTZ a possible Breakout XTZ shows a perfect Accumulation on both wave pattern and a support bounce at 0.94 areas.
If it crosses 1.06-1.08 with a proper market sentiment we can see it reach the previous resistance above mentioned In the chart. SL at 0.92 can be a good entry WEF BTC behaviour isnt bearish.

XTZUSD Bearish Rectangle PatternXTZUSD is exhibiting a bearish rectangle pattern on the 1-hour chart, indicating a potential continuation of the existing downtrend, and the absence of any divergence on the (RSI) suggests that the bearish momentum may persist.
ENTRY-LEVEL SELL STOP: 1.062
STOPLOSS: 1.089
TP 1: 1.036
TP 2: 1.010
RISK 2%

XTZUSD DOUBLE TOP XTZUSD has formed a double-top pattern on a bullish trend, and also experienced a bearish divergence on the Relative Strength Index (RSI), indicating a potential trend reversal towards a bearish direction. This could suggest a decline in bullish momentum and caution for traders and investors.
A double top is a technical chart pattern that occurs during an uptrend and signals a potential trend reversal. It is formed when the price reaches a high point (resistance level) twice but fails to break through it both times, resulting in a pattern that looks like the letter "M".
In the case of XTZUSD, it has made a double top on a bullish trend, which could suggest that the bullish momentum is losing steam and that a bearish trend could be on the horizon. Traders and investors may use this pattern as a signal to sell their positions or to take caution before entering new long positions.

XTZUSD (4H) - Bullish breakoutHi Traders
XTZUSD (Daily Timeframe)
The market is in an uptrend and we are waiting for an entry signal to go LONG above the 1.245 resistance level. Only the downward break of 1.116 would cancel the bullish scenario.
Trade details
Entry: 1.245
Stop loss: 1.116
Take profit 1: 1.325
Take profit 2: 1.454
Score: 8
Strategy: Bullish breakout

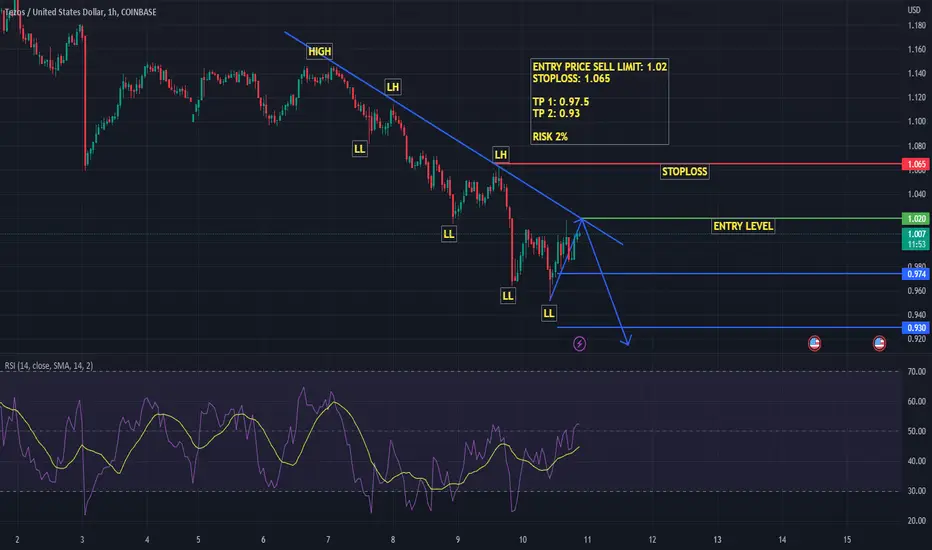
XTZ_USD Bearish TrendXTZ USD is currently exhibiting a bearish trend as indicated by the lower highs and lower lows observed using Dow Theory. Additionally, a bearish trend line on the 1-hour chart further supports this downward trend
ENTRY PRICE SELL LIMIT: 1.02
STOPLOSS: 1.065
TP 1: 0.97.5
TP 2: 0.93
RISK 2%
Tezos and Manchester United for a Top 4this hidden bullish divergence showing up on a few charts here, makes you think that this is a potential attmept at accumulation, most likely will fail and move lower but at least theyre attemping to turn them around

XTZ video 2/22 #googlepartnershipweb3 is gaining web2 giants attention. Google partnered with xtz today so this is a catalyst for more upside no pullback on tezos today with the rest of the market broke above a significant orderblock 1.45 may act as resistance for a retest on 1.30 "a good place to enter" after that 1.45 breaks and we could make it all the way to 1.80 before the next retest

XTZUSD Inverse Head and Shoulders going for 1.9000Tezos / XTZUSD has completed an Inverse Head and Shoulders pattern.
Its technical target is a symmetric leg of the distance from the Head to the Neckline. That is +68.66%.
The MA50 1D is supporting since January 12th.
Trading Plan:
1. Buy the pullback to the MA50 1D or if Resistance (1) breaks first.
Targets:
1. 1.9000 (slightly under Resistance 2).
Tips:
1. The RSI 1D Bullish Flag broke upwards, giving more probabilities to continuing the bullish trend.
Please like, follow and comment!!

XTZUSD: Let's see which team will play final with XTZUSD...FIFA Club World Cup Feb 1 2023 - Feb 11 2023 during this time it's seem need to pay attention!
1.32 and 1.57 resistance level and most likely to some pull back when it reaches 1.31 - 1.32 band.
Graph above shows many things I guess. Be your advisor!!! Hopefully we cheer up at 1.57 on next Sunday.

XTZ Please Z@@M out. ABC complete 5.75 long term targetNot financial advice
Trade idea moving forward.
Look for entry around .75-.95c but long term bullish...
If you like give a thumbs up and follow
Short term I'd look for an entry between .75-85c ish range to go after 2.50 wave 3 target followed by a correction back to current trade levels of 1.00-1.25 then onto the target of 5.75
You can see where we topped at and now we did an ABC correction to restart waves 1-5 with a target of 5.75
This would give us our Long Term D target.
And long term "E" target is .20c this would be a 5 wave corrective life structure.
Always practice patience
#PIK
Patience is Key
#TLAW
Think Like A Whale
