XTZBULLUSD trade ideas


Tezos (XTZ) - Potential swing longXTZ long term channel
Price has broken back inside and has now backtested the channel as support.
If the bullish market sentiment continues, I expect XTZ to pump back towards the top of the channel, potential profit taking at channel levels.
DYOR, NFI

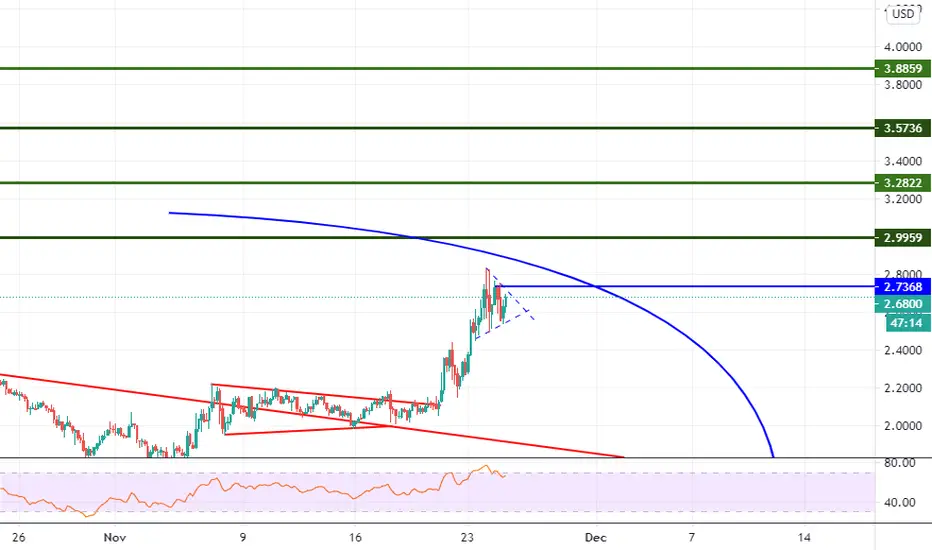
XTZ/USD IN COMING DAYS!!Hi every one
The price was in the Falling wedge for a long time, and after the Falling wedge broke, the price can rise a lot
Targets : 2.8500 _ 3.3000
Support level : 2.0550
we have dedicated a good amount of time for this analysis so support us by like and commenting our posts.
Things can change...
The markets are always changing and even with all these signals, the market changes tend to be strong and fast
Thank you for seeing idea .
Have a nice day and Good luck.


$XTZ - Correction made aswell as 1D MACD flipping + This can be a nice long i have went with a stop loss below the low around 1.77ish, Right now bullish momentum looks good lets see how this plays i will be holding for a long time. Targets can be anywhere from 7$-13$ I will be taking prfoits on the way up and trailing stops. This is just my own thoughts please use this with your own stragety :)

XTZ / Tezos Long TermChannel for Tezos / XTZ. Looks like it is sitting on the bottom of the channel.


XTZUSDTDon't always go all in....
Build your position.
Always put your stop loss.
Risk Management is key..

Not Out of the Woods Yet...Support lines look strong but I suspect there will be plenty of faltering and retesting in the coming week. BTC tumble and a major holiday in America make for plenty of uncertainty. I think fate favors a long hold, but buyers may be able to find a few extra peeps at the resistance.
Observation, not advice.

XTZUSD Tezos TargetsXTZ has been a serious laggard this cycle, but I think it will go back to $4 over the next few months. Targets are on the chart. If it drops below uptrend support, I wouldn't be surprised to see a lower low to $1.7. I know it sounds crazy to think about a lower low given the rise we've seen in BTC and ETH, but it's a technical possibility. I'm long now, but am open to the possibility that a final shakeout could occur. Let's see what happens.

RSI hit 70 and we got the retrace. Not financial advice. Sold my final target at 2.84 and bought in at my target at 2.40. Increase your stacks people! 21 will reward the heavy tezos holders! Next stop 3.20 and above once we consolidate!

xtz 11.25.20Looks like it is breaking out and retesting resistance as support. If it fails look for it to come back into the lower demand area trend line


XTZ gaint ascending channelZTX/USD
🌟 Techincal Analysis🌟
Not a much talking
gaint ascending channel
If the price can hold above 1.77$ this idea is active
Note : not a buy signal from this point
Signal comes with buy area and stop loss and sell targets
Just directional route for who already in (long term)
Good luck and happy trading 🌹

XTZ vs USD , who will win?breaking 2.74 will activate more targets for the upside .
watch the called bottom for #XTZ on the related ideas
don't forget to like it , if you actually like it
your support is appreciated TIA
Up! (just learning)It seems like a triangle on the 4hr chart more upside is on the way!
The weekly chart shows a good reversal trend for the coming weeks where i think we will go to the upper trend line and hopefully even beyond!
Not financial advice I'm new and just learning, please share you're thoughts.

XTZ - Upwards Trend to New ATHWe saw a double bottom pattern playout - with a fib retracement extention from local high to local low.

XTZUSD to see a breakout(1D) | Potential gap up observedMarket in last 1 week
XTZUSD saw consolidation with the price started to ride the upper Bollinger band
Price volatility was very high. The market moved ~39.79%, between $2.814 and $2.013
Today’s Trend analysis
XTZUSD expected to see a breakout as potential gap up observed with Bollinger band expanding
Price at time of publishing: $2.815
XTZ’s market cap: $2.105 Billion
Oscillator indicators are mostly neutral. RSI at 72
Moving average indicators are biased towards an uptrend. Ichimoku Cloud is neutral and Hull MA indicates a buying opportunity
Volume indicators saw a decrease in volume with price declining while volume increased as price increases
Price expected to see a breakout as potential gap up observed with Bollinger band expanding. Most of the Oscillator indicators are neutral. MACD line moving above the signal line with histogram size increasing in the positive region, suggesting a bullish bias. RSI at 72, in the overbought region indicating a downtrend soon. CCI is around 297, in the overbought region indicating a downtrend. Another interesting point to notice here is that volume saw a decrease in volume with price declining while volume increased as price increases indicating a strengthening buying pressure.
----------------------------------------------------------------------------------------
The analysis is based on signals from 28 technical indicators, out of which 17 are moving averages and remaining 11 are oscillators. These indicator values are calculated using 1 D candles.
Note: Above analysis would hold true if we do not encounter a sudden jump in trade volume .
----------------------------------------------------------------------------------------
If you find the analysis useful, please like and share our ideas with the community!
- Mudrex

Trading plan for XTZRSI above 70 be careful! First selling targets hit, will be buying around to 2.40 to increase stack, Hold on to a little XTZ Incase we keep soaring. Next target 3.20.
The goal here is to increase XTZ holdings!!!

