Xtz/usdIf you remember back when I said I was targeting this level a month or so back (when price was mid 3’s) and was told I was crazy. Well here we are and I did just that. Bought a fat stack at 1.91 for a LONNNGG hold. I also have a buy at 1.50, if I luck out and get that area as well. Good luck y’all!
XTZBULLUSD trade ideas

Bearish pattern breakdown and support levels to watch out for*DISCLAIMER: I am not a financial advisor and this is not financial advice as these are purely my opinions and speculations. I do not guarantee any results nor am I responsible for your actions. You should always do your own due diligence before trading or investing in this market as it is extremely risky.
*Follow me for the latest cryptocurrency analyses on my watchlist
*Thank you to those who donated, I very much appreciate it.
*Let me know in the comment section if you agree or disagree, would love to hear your ideas too.

TEZOS (XTZUSD) Buy SignalPattern: Channel Up on 1D.
Signal: Buy as the price is testing the Higher Low trend-line of the Channel, following a Death Cross, being on the 0.618/ 1.236 Fib aggregate that previously was a buy zone.
Target: 4.500 (Resistance) and in extension 8.500 (Higher High of the Channel Up)
TA very successful on previous Tezos signals:
** Please support this idea with your likes and comments, it is the best way to keep it relevant and support me. **
--------------------------------------------------------------------------------------------------------
!! Donations via TradingView coins also help me a great deal at posting more free trading content and signals here !!
🎉 👍 Shout-out to TradingShot's 💰 top TradingView Coin donor 💰 this week ==> TradingView
--------------------------------------------------------------------------------------------------------

XZT broke bull trend We will see at least at 1,3usd
There are many bear signals and there is no chance to go UP.

Be Patient And Wait For ThisAfter riding SHORT down to the $2 region, I'm expecting another short leg down toward $1.8 to $1.9 before we ride back up again to the upside. Stay safe and happy speculating.

Bear flag - short XTZWe have big bear flag on daily chart. 1,8usd seems very close.
If you want to buy XTZ, you have to wait for signal.
There is no buy signal.
Good look with your trade!!!


Elliot Wave Massive incoming profits for tezos in about a yearThis fall belongs to the Black Swan incident, not because the industry's development prospects are uncertain, nor is there a major loophole in bitcoin technology, so you know, the fall is more a contagion of emotions and a release of funds, so it is a rare opportunity to slowly buy in positions. This is not an investment advice.


XTZ is waiting untill the last moment for a real pumpSome altcoins are already in the safe zone, like ethereum and some others, although xtz is being held firmly in the killzone to keep the holders and leverage traders in anxiety, there is no logical reason for this, it's a just a panic effect and whale manipulation together. It is only a matter of time before XTZ will reach for 2.50, I expect this to happen just before of just after the american presidential election. XTZ is a really technically sound cryptocurrency, far better than link and some others tokens and cryptocurrencies in the top 10.

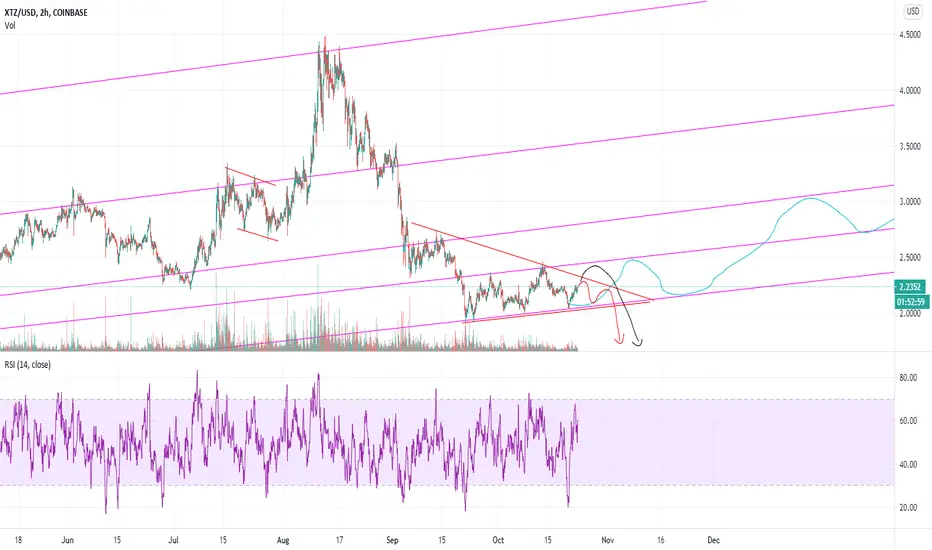
XTZ to see down breakout(1D) | Head & Shoulder Pattern completedMarket in last 1 week
XTZUSD saw a sideways movement with the price increase followed by a decline
Price volatility was very high. The market moved ~11.24%, between $2.268 and $2.038
Today’s Trend analysis
XTZUSD expected to see a breakout downtrend as the Head and Shoulder pattern is completed with the volume confirming the pattern completion
Price at time of publishing: $2.0977
XTZ’s market cap: $1.569 Billion
Oscillator indicators are mostly neutral. RSI at 42
Moving average indicators are biased towards a downtrend. Ichimoku Cloud is neutral and Hull MA indicates a selling opportunity
Volume indicators saw a decrease in volume with price increase while an increase in volume observed with a price decline, with the total volume being below the 20-candle moving average
Price expected to see a breakout downtrend as the Head and Shoulder pattern is completed with the volume confirming the pattern completion. Most of the Oscillator indicators are neutral. MACD line moving above the signal line with histogram size decreasing in the positive region, suggesting a bullish bias. RSI at 42, below the midline in the neutral region. CCI is around -112, in the oversold region indicating a downtrend. Another interesting point to notice here is that volume saw a decrease in volume with price increase while an increase in volume observed with a price decline indicating strong selling pressure.
----------------------------------------------------------------------------------------
The analysis is based on signals from 28 technical indicators, out of which 17 are moving averages and remaining 11 are oscillators. These indicator values are calculated using 1 D candles.
DM to get details of the above analysis and list of indicators & their values used to arrive at the above conclusion.
Note: Above analysis would hold true if we do not encounter a sudden jump in trade volume .
----------------------------------------------------------------------------------------
If you find the analysis useful, please like and share our ideas with the community!
- Mudrex

Some marketmanipulation before the real bullrunThe 4 RSI is extremely oversold on XTZ and it comes at a good time, if XTZ manages to close above 2.08 the chances are we'll never see sub 2.1 again. The RSI is nearly under 10 on the 4 h RSI.

Keep eyes on XTZAfter a huge drop XTZ may finally make a comeback; or it may get worse. Could go break out either way, best to stay safe and wait for confirmation. Looks like there might be sufficient support around 2.05 for price to bounce off resistance and go back up.
