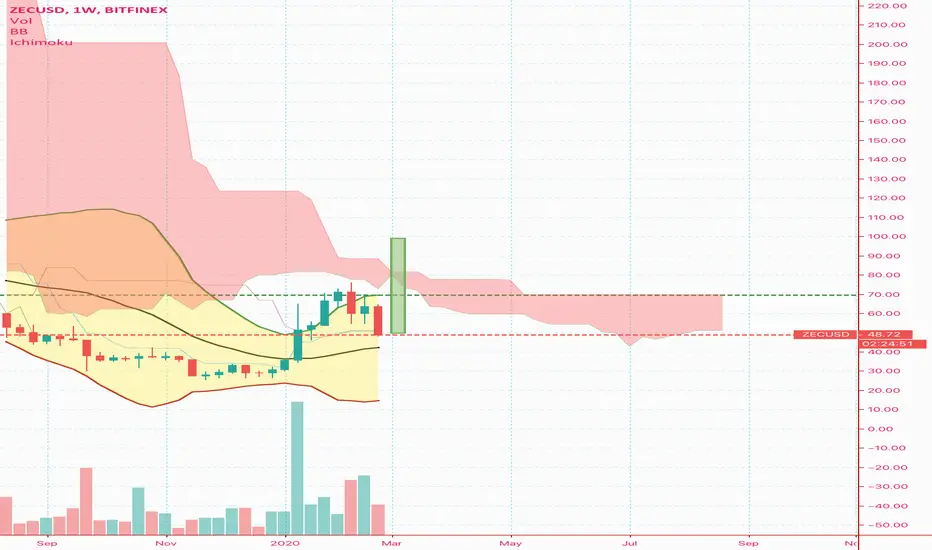
6 months till #ZCASH halving. Leaning BULLISH. I see a similar bottoming/accumulation structure as the big dump since genesis and huge mark up phase after.
Only difference is a longer time frame needed to leave this current huge range.
Current structure
I esp like the volume spikes early this year. Usually very early signs of bullishness.
2016/2017 bottoming structure
I believe anywhere from sub $20 to $50+ range is a strong buy. Please do note that this is a high risk play based on the current COVID-19 situation.
A price drop in any situation below $21/22 range will be worrying & I will consider getting out of the whole position.
I'm not gonna throw in any price targets yet, but you should know that Zcash is the leading privacy coin of the whole cryptospace. It's halving is not to be missed.
ZECPERP trade ideas

Last Call Aboard The Zcash ExpressPack your bags. Kansas is going BYE BYE
So long $33. Nice knowin ya


ZECUSD when next bull run 450% gains (NEW)before we kick start the update. your upvotes/subs are appreciated.
Why get subbed to to me on Tradingview?
-15+ years real live trading experience
-TOP Author on TradingView
-professional chart break downs
-key levels
-no junk on my charts
-frequent updates
-covering FX/crypto/US stocks
-24/7 uptime so constant updates
So without further due. Keep it short/simple and to the point.
ZECUSD next bull run 450% gains (NEW)
IMPORTANT: this is a speculative setup, performance
is not guaranteed, so please use a tight stop loss.
and always do your own due dill. thank you.
Tagged as SHORT as short-term I expect more losses
before reversal/dump.
ZECUSD 4d Kraken. Potential/speculative setup.
Next cycle lows may/june 2020.
bull run 450%+.
good luck traders!
get subbed to stay tuned for all the latest updates.
also add likes to support my efforts, thank you.

Zcash/usd - level sublimation A puncture and fixation over the level would be a buy signal for me.
there will be a clear stop loss.
and in the meantime, without a puncture, there's a chance of going down.
Friends, thanks for your likes and comments!
Good luck with trading!

Zcash: $500 By ChristmasCurrent downtrend shows Zcash hitting $0 by EOY 2020
Such an occurrence is out of the question
Prepare for a breakout sooner than later as smart money seeks out alternative wealth storage vehicles in light of the Federal Reserve's plan, as revealed this morning, to initiate an unlimited asset purchase program

ZECUSD Leading The Way?ZecUSD Reclaimed 1H 200MA Sitting idly by at 29.0 flat.
Looking at every alt and major coin, everything looks like it is posturing to do the exact same thing ZEC just pulled off.
Zec Will retest its 21 and 50 1H MAs then attempt higher again.
If it holds a 4H bar above the 50Ma Things start looking much better above.


ZECUSD - NeutralHello All!
I will share my thoughts of the current market situation and any possible targets. You can make your conclusion out of this and make your own decision how to play it!
Zcash ; the blue pattern on the chart looks like a falling wedge pattern which often break bullish and so it did this time. The green pattern where we currently are trading in seems like a descending triangle which often is bearish.
I have 2 scenarios in mind ; we break bearish to the broken trend line of the previous pattern. Keep a look at what BTC is doing , if there’s a bearish breakout than you can confirm this reaction. Or we break the pattern bullish and will go for a test at resistance (trendline on the chart)
Anyway, it is smart to wait for a breakout before entering a trade.
Do you have a chart that you want me to look into? Send me a message and perhaps I will publish it, I like doing this stuff! Keep in mind that I’m not a financial adviser!
Next target; give this idea a like and me a follow : ))))
Thanks for your support !
Remember ; Every Moment Is Unique !


ZEC/USD LONG SET UPBUY ZEC/USD
ENTRY 1 36.86
Entry 2 30.46
SL 23.46
Tp.1 42.86
Tp.2 46.46
Tp.3 52.86
Tp.4 62.46
tp.5 76


ZECUSD Trade Idea | 2020/02/23 | Target Price 43.27349884ZECUSD Parallel Channel. Trade Idea From 2020 February 23

Pulse of an asset via Fibonacci: ZEC at crucial Impulse ReduxMarket wide sell off in progress.
Most coins retraced last bull wave.
Many coins are now at Impulse Redux.
"Impulse" is a surge that creates "Ripples", like a pebble into water.
"Impulse Redux" is returning of wave to the original source of energy.
"Impulse Core" is the zone of maximum energy, in the Golden Pocket.
Are the buyers still there? Enough to absorb the selling power?
Reaction at Impulse is worth observing closely to gauge energy.
Rejection is expected on at least first approach if not several.
Part of my ongoing series to collect examples of my Methodology : (click links below)
Chapter 1: Introduction and numerous Examples
Chapter 2: Detailed views and Wave Analysis
Chapter 3: The Dreaded 9.618: Murderer of Moves
Chapter 4: Impulse Redux: Return to Birth place <= Current Example
Chapter 5: Golden Growth: Parabolic Expansions
Chapter 6: Give me a ping Vasili: one Ping only
.
.
Ordered Chaos
every Wave is born from Impulse, like a Pebble into Water.
every Pebble bears its own Ripples, gilded of Ratio Golden.
every Ripple behaves as its forerunner, setting the Pulse.
each line Gains its Gravity .
each line Tried and Tested.
each line Poised to Reflect.
every Asset Class behaves this way.
every Time Frame displays its ripples.
every Brain Chord rings these rhythms.
He who Understands will be Humble.
He who Grasps will observe the Order.
He who Ignores will behold only Chaos.
Ordered Chaos
.
.
.
want to Learn a little More?
can you Spend a few Moments?
click the Links under Related.

ZEC - Zcash - STRONG BUYZECUSD : STRONG BUY
Analysis Method: Fibonacci & Wave Theory
About Zcash: z.cash
Launched in 2016 by Zooko Wilcox-O’Hearn and based on the Zerocoin protocol, Zcash (ZEC) is a decentralized and open-source privacy-focused cryptocurrency that enables selective transparency of transactions. Zcash transactions can either be transparent or shielded through a zero-knowledge proof called zk-SNARKs. This allows the network to maintain a secure ledger of balances without disclosing the parties or amounts involved. Instead of publishing spend-authority and transaction values, the transaction metadata is encrypted and zk-SNARKs are used to prove that nobody is being dishonest. coinmarketcap.com
Monthly: High/Low
Daily: Fib-Time/Minor Wave 1 & 2
6 Hour: Minor Wave 1 & 2
-Waves %: Extended 3rd
Minor Wave 1: 151%
45 Minute Chart: Micro-Wave
Immediate Target Area: $53-$57
Timeframe: 6 Days
Target Area: $85-$110
TimeFrame: 60 Days
Will update.
-FMW


ZCash longZCash have a chance to break out a thin place in ichimoku cloud.
This patterns is usually works on same charts.
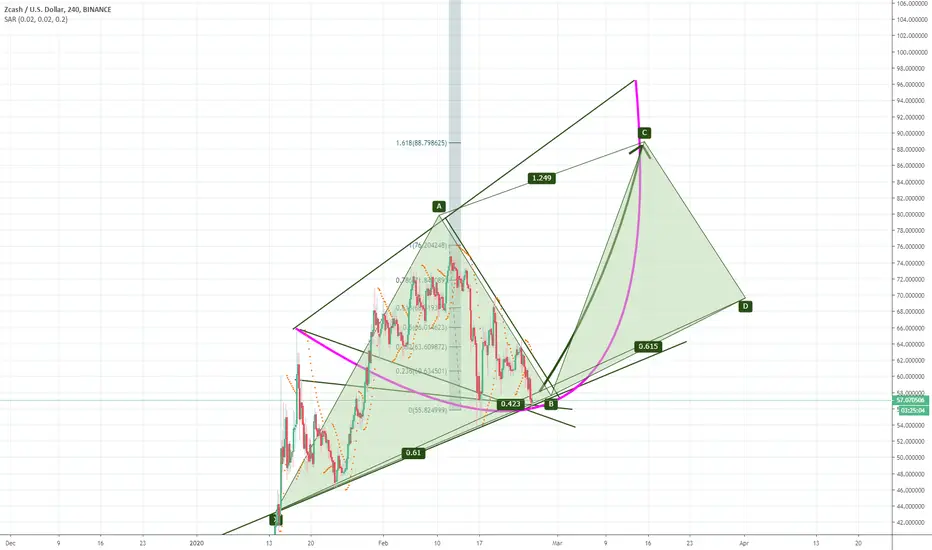
ZECUSD forming bullish Cypher | Upto 85% expectedHi friends hope you are well, here I have found another profit potential trading idea for you and this time I have found a harmonic move by Zcash (ZEC). The Priceline of ZEC is forming bullish Cypher pattern and soon it will be entered in potential reversal zone and will be ready for bullish reversal soon.
Lets have a look on the Zcash priceline's move:
After initial leg (X to A) the A to B leg is retraced between 0.382 to 0.618 Fibonacci and then B to C leg is projected between 1.272 to 1.414 of A to X leg's Fibonacci projection and final (C to D) leg is suppose to be retraced between 0.618 to 0.786 Fibonacci projection of X to D leg for a perfect bullish Cypher and then the price action will be entered in potential reversal zone of this bullish Cypher pattern, then we can expect bullish divergence at any time which will lead the priceline between 0.382 to 0.786 Fibonacci projection of C to D leg.
www.tradingview.com
Buying And Sell Targets:
The buying and sell targets according to harmonic Cypher pattern should be:
Buy between: $44.84 to $36.37
Sell between: $51.51 to $67.50
So this is upto 85% profit opportunity
Stop Loss:
The potential reversal zone area which is up to $36.37can be used as stop loss in case of complete candle stick closes below this level.


ZEC: The BUY Opportunity** Not Financial Advise **
** Personal Opinion **
** Good Luck Have Fun Make Money **
ZCASH 2x in 2 months. Let's GO!
ZEC