ZRX ready to move upLike many alt-coins 0x has had the seven bells beat out of it and is ready to pounce with very little influence from Bitcoin.
ZRXPERP trade ideas
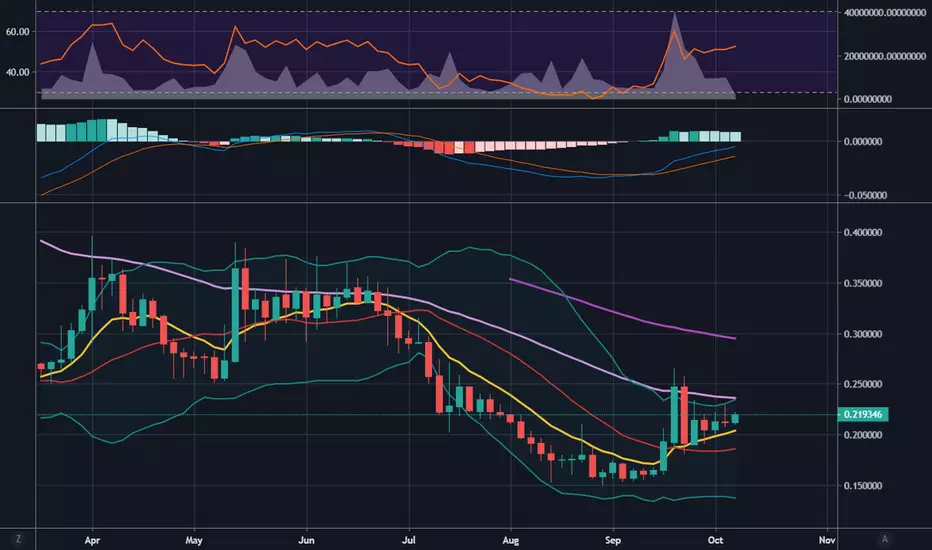
There is a possibility for the beginning of an uptrend in ZRXUSDTechnical analysis:
. 0x/US Dollar is in a range bound and the beginning of uptrend is expected.
. The price is below the 21-Day WEMA which acts as a dynamic resistance.
. The RSI is at 56.
Trading suggestion:
. There is a possibility of temporary retracement to suggested support zone (0.203000 to 0.137800). if so, traders can set orders based on Price Action and expect to reach short-term targets.
Beginning of entry zone (0.203000)
Ending of entry zone (0.137800)
Entry signal:
Signal to enter the market occurs when the price comes to " Buy zone " then forms one of the reversal patterns, whether " Bullish Engulfing ", " Hammer " or " Valley " in other words, NO entry signal when the price comes to the zone BUT after any of reversal patterns is formed in the zone. To learn more about " Entry signal " and the special version of our " Price Action " strategy FOLLOW our lessons :
Take Profits:
TP1= @ 0.270000
TP2= @ 0.360000
TP3= @ 0.460000
TP4= @ 0.558800
TP5= @ 0.690000
TP6= @ 0.813500
TP7= @ 1.019000
TP8= @ 1.223000
TP9= Free


ZRXUSD formed bullish gartley | Upto 40% expectedPriceline of ZRX / US Dollar cryptocurrency has formed a bullish Shark and it is entered in potential reversal zone to hit the sell targets soon insha Allah.
This PRZ area should be used as stop loss point in case of complete candle stick closes below this zone.
We have 50 simple moving average support within PRZ area but volume profile is showing traders interest even below the potential reversal zone, Stochastic is oversold and did not give bull cross and MACD is strong bearish so for secure trade we can wait for MACD to turn weak bearish or for stochastic to give bull cross then buy.
I have used Fibonacci sequence to set the targets:
Buy between: 0.194078 to 0.174767
Sell between: 0.209236 to 0.245689
Regards,
Atif Akbar (moon333)

ZRX.USD up against crucial Resistance: 0x bulls at a checkpointQuick plot to show the various Fibs in play.
Currently bumping up against a resistance band.
Bulls need to break through and retest as support.
Left Chart is 6h tf, with fib of drop from 36 cents.
Right Upper is 2h tf, with fib of bounce from 16 cents.
RIght Lower is 1h tf, with fib of last drop from 26 cents
We are currently within the first resistance zone.
Above is next resistance that is recently proven.
After that, there is decent open space for growth
.
See some of my other plots and trade calls below.
I also plot Forex and Stocks, take a look at my profile page .
ZRX breakout (massive Profits, short wait)
LTC to $150 call (near perfect plot)
BTC $14k call (Near Perfect target, easy trade)
ETH breakout (instant Profits, no drawdown)
BTC bottom 3.1k (caught the EXACT bottom)
ADA breakout (PERFECT targets, massive profits)
XLM breakout (massive Profits, instant Win)
RVN top call (Perfect Target, take profits)
LINK re-entry (caught the spike)
MATIC top Warning (caught the EXACT top)
MATIC rocket (massive Profits, breakout entry)
NEO Rocket Launch (great entry, massive profits)
FET top warning (EXACTLY on time)
DASH top warning (EXACTLY on time)
Of course, I have had total FAILS on some ideas too, not going to pretend.
But all of my plots show PRECISE entries, TIGHT stops, and EXACT targets.
Precision is the way of the Fib. Almost every turn happens at a Fib Line.

ZRXUSD likely to fail in breaking down 100 SMAThe priceline of ZRX / US Dollar is likely to form a bullish gartley.
Initial X to A was not able to break 200 simple moving average resistance and now the B to C leg is hitting the 100 SMA resistance and likely to fail in break out.
Volume profile is showing less interest of traders here.
MACD turned weak bullish from strong bullish, but stochastic did not give bear cross sofar so we can wait for stochastic to give bear cross and then short.
I have used Fibonacci sequence to set the targets:
Sell between: 0.212765 to 0.255376
Buy between: 0.194078 to 0.174767
Regards,
Atif Akbar (moon333)


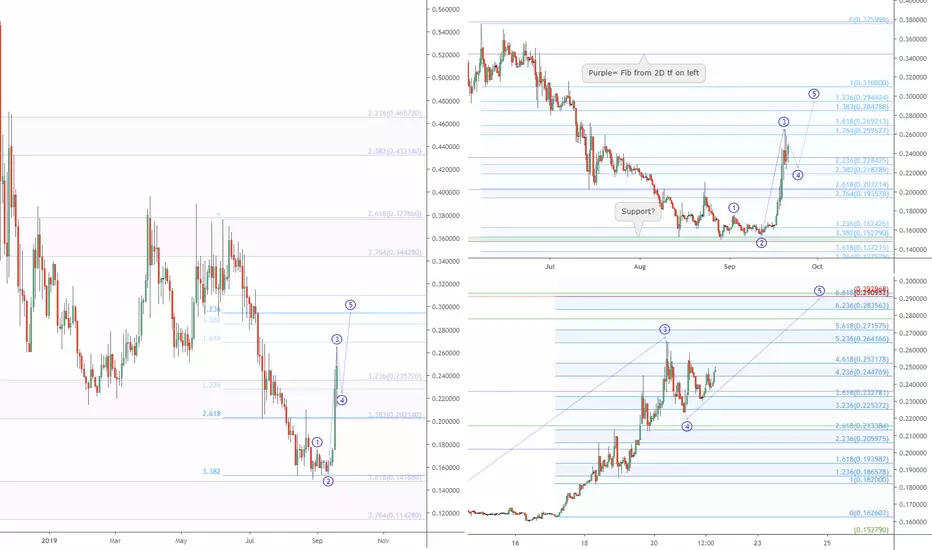
ZRXUSD rocketed (65%) from last Buy call, now plotting end pointFollow up to my last Buy call which sprang for 60% gains (click) .
ZRX launched a nearly vertical climb which is common for wave 3's.
Currently appears to be in a Triangle pattern common to wave 4's.
Breakout of this consolidation should go for a new high as wave 5.
Wave 5's are less "predictable" than wave 3's and 4's.
It is possible that we get a "double top" with wave 3.
It is more likely that we get a "higher high" into Band 6.
Left chart is 2-day timeframe for the Big Picture Fib.
Right upper is 12-hour tf for fib of last wave down.
Right Lower is 1-hour tf for fib of bounce thus far.
0.2900 - 0.2930 would be a good Take Profit zone.
0.2640 - 0.2650 would a good Trailing Stop if surpassed.
0.3440 - 0.3780 would be the highest expectable target.
ZRX/USD entry at 0.235 0.24ish cents Outlook for next few daysHi, guys, this is my first chart here so be nice :)
This is my outlook for ZRX for the next few days.. Could be some good profitable targets in the next few days/week
With bakkt coming up I feel like BTC will DROP .. ZRX is not tied to BTC price in any way so even if ZRX/USD doesn't work out ZRX/BTC could catch the loss if any were to be made in ZRX/USD (quite unlikely)
As know from before institutions and big corporations never buy assets in any form at a high price when trading and entering positions with such high trading volumes.. they will play with the market in order to drive price down... Why buy BTC for 10,000 USD when it can be bought for 8,400 or even levels as low as 6,000 (seen earlier this year)...
Good luck guys :P

ZRXUSD has formed bullish butterfly | Upto 203% possiblePriceline os Ox / US Dollar has formed a bullish butterfly and entered in potential reversal zone.
RSI is oversold.
Price action is also hitting at the support of lower band of bollinger bands.
Volume profile of complete pattern is showing weak interest of traders within PRZ area.
From here the price action will take bullish divergence soon insha Allah.
I have used Fibonacci sequence to set the targets.
Buy between: 0.1721 to 0.1106
Sell between: 0.2199 to 0.3356
Regards,
Atif Akbar (moon333)

ZRXUSD may have bottomed around 15 cents: 0x should bounce soonZRX like many Alts just keeps dropping lower and lower.
Currently showing a bottomming process (slow and wide).
Several Fib sequences look to be ending around 15 cent price.
Left Chart is 2-day timeframe with Fib of decline since CoinBase intro.
Right Upper is 6-hour tf with fib of decline cuased by last Impulse down.
Right Lower is 1-hour tf with a possible UPWARD Impulse/Fib in progress.
CHART NOTES:
Drag UP on the PRICE scale to reduce overlapping numbers.
Drag DOWN on PRICE scale to see fibs above/below window.
.
See some of my other plots and trade calls below.
I also plot Forex and Stocks, take a look at my profile page .
Currently in Play:
LTC bottom at $65?
BTC importat Levels
Alt Extinction Event?
Recent Achievements:
ZRX Last breakout (massive Profits, short wait)
ADA breakout (PERFECT targets, massive profits)
BTC to 14k call (Near Perfect target, easy trade)
BTC bottom 3.1k (caught the EXACT bottom)
LINK re-entry (caught the spike)
LTC to $150 call (near perfect plot)
MATIC top Warning (caught the EXACT top)
NEO Rocket Launch (great entry, massive profits)
ETH breakout (instant Profits, no drawdown)
MATIC rocket (massive Profits, breakout entry)
XLM breakout (massive Profits, instant Win)
FET top warning (EXACTLY on time)
DASH top warning (EXACTLY on time)
Of course, I have had total FAILS on some ideas too, not going to pretend.
But all of my plots show PRECISE entries, TIGHT stops, and EXACT targets.
Precision is the way of the Fib. Almost every turn happens at a Fib Line.
.


ZRXUSD: A Coinbase ChaseZRXUSD is the first alt we have looked at where we feel that strength begets strength.
In ZRXUSD resistance is at $.026. That may only hold temporarily as the up move may target the high of the previous 4th wave near $0.40.
Bottom Line: Coinbase users that missed the Stellar spike may pour into ZRXUSD until it reaches $0.40. There are so many Coinbase users that ZRXUSD may not need a fundamental reason to go up beyond.
It's a Coinbase chase.

ZRXUSD just kissed a dreaded 9.618, get ready for pullbackQuick post to alert that ZRX has just hit a 9.618 extension.
The 9.618 is very often the Murderer of Moves, so be alert.
Most common pullback zone is the 4.618-4.236 extensions.
This will be a gauge of the true strength of this bullish move.
If it blows past the 9.618, be wary of a "bull trap" and collapse.
Or if gets past 9.618, retests, and bounces, then bulls are strong.
This bounce was EXPECTED per this plot I posted 3 days ago (click) .
But now it might time to pullback and reload down lower.
I have closed 1/2 of my longs, and rest are on trailing stops.
.
See some of my other plots and trade calls below.
I also plot Forex and Stocks, take a look at my profile page .
Currently in Play:
LTC healthy bounce
BTC to 21k ?
EOS bounce Watch
ZRX going full Bull
Alt Extinction Event?
Recent Achievements:
LTC to $150 call (near perfect plot)
BTC $14k call (Near Perfect target, easy trade)
ETH breakout (instant Profits, no drawdown)
BTC bottom 3.1k (caught the EXACT bottom)
ADA breakout (PERFECT targets, massive profits)
ZRX breakout (massive Profits, short wait)
XLM breakout (massive Profits, instant Win)
RVN top call (Perfect Target, take profits)
LINK re-entry (caught the spike)
MATIC top Warning (caught the EXACT top)
MATIC rocket (massive Profits, breakout entry)
NEO Rocket Launch (great entry, massive profits)
FET top warning (EXACTLY on time)
DASH top warning (EXACTLY on time)
Of course, I have had total FAILS on some ideas too, not going to pretend.
But all of my plots show PRECISE entries, TIGHT stops, and EXACT targets.
Precision is the way of the Fib. Almost every turn happens at a Fib Line.

0x analysis will we finish the head and shoulders pattern and go down or the s / r zone resist and price will go up?

ZRX.USD P-Modeling Pt 6. Evisceration of the Alt MarketStart here at Part 5 to see how we got here. This chart was a failure. Let's try again. Shall we :). I think now we can capitulate.
Welcome to the Valley of the Capitulated..
This is trial number two at the Flying V of Death.
Alt Market Evisceration incoming...
First on the kill list is ZRX.
If I am wrong. Oh well.. I shall try again. :)
Failure is part of success.
Target Buy Avg is 0.45
or -77% of its current value.
Yep. You heard right.
Glitch420

ZRXUSD Testing 2017 Low 0x Exchange is Testing 2017 Low .
The information provided here is not financial advice.
Always do your own research.

ZRX (ZRX/USDT, 1D) Price is testing the historical minimumZRX is testing the historical minimum and the middle of the channel. Very interesting to buy right now. Good luck everyone!

Spring in Septemberzrxusd is, if you go by the wyckoff method, almost finished with the accumulation phase. what we see here is the beginning of a new trend. if my assumptions are right, it could come to a rapid price increase in the next days.
if you take the last part out of this pattern, you will see a falling wedge with a breakout and retest of the trendline.
the last image is displayed logarithmically. potential price targets are shown.
