ARCHIDUKE
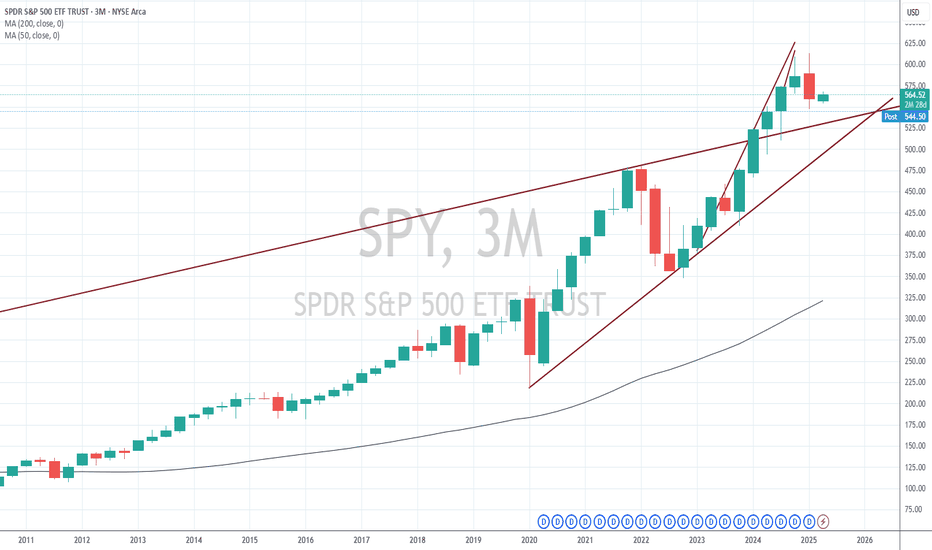
Good support at 530 , if it fails it will be a quick trip to 500
we are at trend support , so expecting a bounce here if the trendline holds
Its only a matter of time , before meta hits all time highs for now there is going to be a slight battle around 285 area in an attempt to get back into the channel.
the daily chart is bullsish , short term uptered was broken, around 379, so this is all mixed signals , and that means I will stay on the sidelines ,my hunch is , it will likely see heavy selling in the last week of July and then bottom down there around 355-365 range
that morning star (spinning bottom) on the daily chart means we might have a short term pop to 390-400 range
Duicy short, dont be that guy that keeps pumping stonks
chart is self explanatory if 414 holds , its going higher.
chart is self explanatory , I can only buy it if it holds 125
spinning tops usually mean buyers are getting tired and exhausted.I expecta good sell off to 395-400 range within the next two weeks
chart is self explanatory , as you can see we also have a bullish reversal hammer candle
Am seeing a very big green candle tomorrow.
its getting too berish on this board and since the majority posting are just amtuers , you know what that means, the weekly ndle is likely gong to be a bih green one ., or a greem hammer.
chart us self explanatory , this time its going to mess with 150
support at 275, will start looking into long positions there


