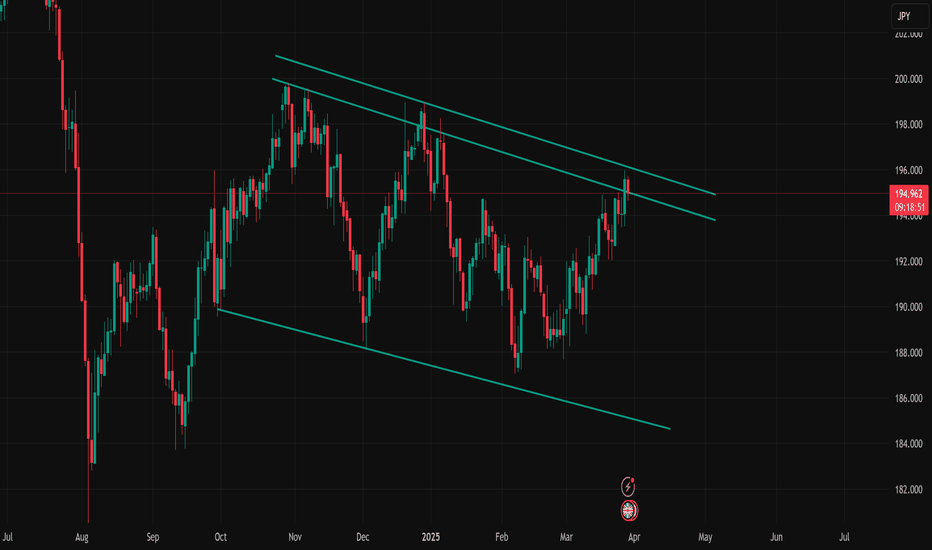
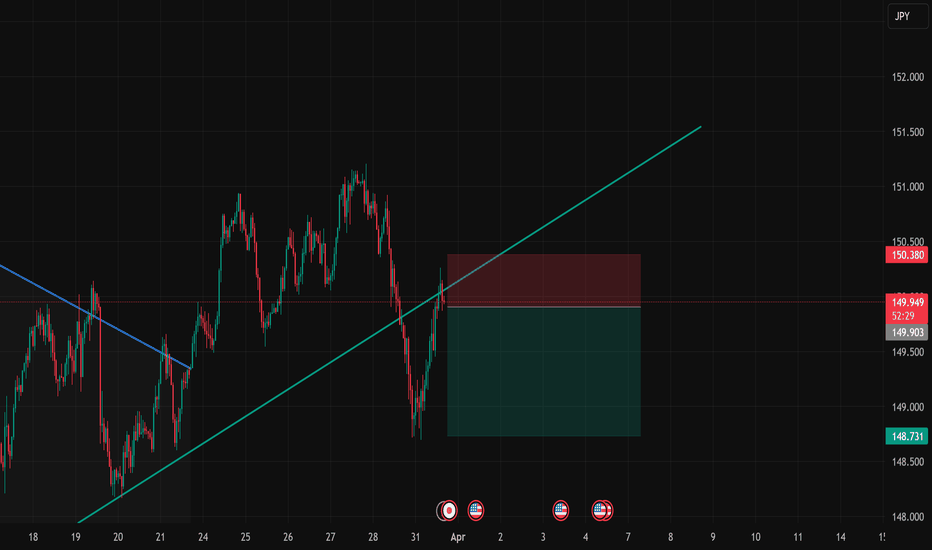
The USD/JPY pair recently experienced a bearish movement, which is largely influenced by heightened concerns surrounding the ongoing trade and tariff tensions between the U.S. and its global counterparts. This risk-off sentiment triggered a flight to safe-haven assets, weighing on the pair. However, price action has now approached a key trendline support zone,...
The CAD/CHF pair has been under sustained bearish pressure, reaching historic lows amid continued CHF strength. The ongoing U.S. trade and tariff tensions have heightened global uncertainty, driving investors toward safe-haven currencies like the Swiss franc. In contrast, the Canadian dollar remains sensitive to risk sentiment and commodity demand, amplifying the...
USD/CHF has been in a sustained bearish trend, but is currently consolidating in a sideways range on the 4-hour timeframe. A breakout to the upside could signal a potential trend reversal on the higher timeframes.
GBPJPY has been on a bullish run for sometime, currently there is some sell opportunity. lets look if its a bearish movement or just a retracement
USDCHF has been moving between support and resistance levels thereby creating a sideways movement on daily and weekly timeframes, also creating some flag patterns, currently, there is a potential sells on weekly and daily timeframes, we might see a little movement up to the resistance zone at 92081, creating a triple top pattern before starting the downward...
NZDUSD has been bearish for a while, and it seems to be starting a new bullish movement. currently on a support and valid uptrend on a 4h timeframe
USDJPY is currently reacting off the resistance zone on a 1hr and this might see a bearish continuation off that zone
a possible bear or bull movement; if it bounce back from the current position, then it might continue the bull move but if the breaks don happen, then it might be going for the next support
NZDCAD Has just drop to a bearish movement on a weekly timeframe; there is currently a continuous bearish movement on a daily TF
it seems to be a similar movement n most of JPY pairs a possible bearish movement on eurjpy on a daily timeframe
TREND REVERSAL double bottom ChfJPY has been falling for a while now; its currently at a major support on Hourly and daily timeframe and it might be a chance for a reversal
Bitcoin has been in a range for a while and it's looking like there is a possible buy currently
The Market has been in a parallel channel and we might see a short sell on a 4hr and 1hr timeframe but the overall market looks bullish
CADCHF has been moving sideways for some time now and it seems ready for a breakout, the overall look is an upward breakout movement, it might have a short retest in key support zones as marked on the chart above or just breakout upward instantly without retesting the support zones let's watch the market these coming weeks comment, share and like
USDCAD just touched a trendline resistance on a daily timeframe, the resistance zone has successfully push the trade down twice and we expect a new bearish movement from that zone
GBPCHF is currently ranging on a 4 hours timeframe, a break out downward might confirm a bearish movement and a breakout upward will invalidate this analysis
The NAS100 is currently trading around 13340, which is the 3rd touch on the trendline that started on December 2021, We can a trend resistance at that point, so i expect a bearish reversal from 13349 Market has been overbought and RSI, Stochastic and CCI i will be waiting for a bearish confirmation to enter the market This is my analysis whats your take on...
There is trend resistance on a 4 Hours Timeframe Overbough on RSI, STOCHASTIC and CCI


