Ethereum remains in its overall downtrend 📉; however, the recent sharp upward move shows early bullish signals 🟢. The highlighted supply zone in red ($1994–$2012) could serve as a strong resistance area, potentially triggering a pullback. Additionally, the daily flip level (marked in green) may also act as a barrier, pushing price lower. Despite the bearish...
Bitcoin Technical Update Bitcoin has broken above the descending trendline, entering a bullish phase 📈. Currently, BTC is approaching a major supply zone between $95,600 and $96,800 🟥. In order to fuel a powerful move above $100,000, Bitcoin needs additional buying momentum, which could come from the demand zone located between $67,700 and $69,300 🟩. Thus, a...
On the 4-hour timeframe, Bitcoin has broken above the descending trendline 📉 — however, the breakout lacks strong momentum, and no higher high has formed yet. Therefore, we cannot yet confirm a shift from a bearish to a bullish trend. According to the Fibonacci retracement tool, price is currently ranging between the 0.236 and 0.382 levels. These two zones could...
Ethereum Technical Outlook 🧠 ETH is currently in a downtrend on both the daily and 4-hour timeframes 📉. The $2100–$2150 range, which previously acted as a major support level, has now turned into a key resistance zone 🔄. Price is moving within an ascending channel 📈 and approaching a supply zone located between $1790–$1820 🟥. For a confirmed trend reversal,...
Based on the previous analysis, Bitcoin 🟠 has respected the ascending trendline 📈 and is currently advancing toward the $84,000 resistance zone. Over the next 48 hours ⏳, a potential rejection ❌ from the supply area (marked by the red rectangle 🟥) is anticipated. Should the ascending trendline 📈 fail to hold, a retest (pullback) 🔄 toward the broken trendline may...
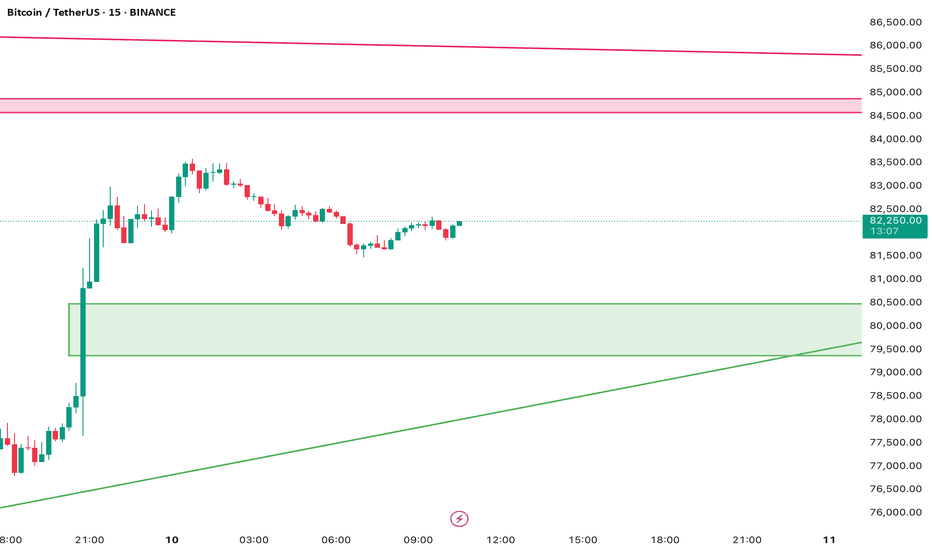
📊 Bitcoin Update - Quick Analysis On the 15-minute chart, Bitcoin is moving between two key horizontal zones and two dynamic trendlines: ✅ The green zone marks a price gap — a great spot to look for buying opportunities. ❌ The red zone acts as a supply area and could slow down or reverse the price. 🔎 A green trendline on the lower timeframe is supporting bullish...


