Since June AAPL has been forming a topping pattern (H&S) and looks like it is ready to start moving lower again. The left shoulder, head and right shoulder being formed are symmetrical in time and price. The right shoulder started with the September CPI report (released in October) and was reinvigorated by the October CPI report released in November both of...
Ratio chart of SLV /SPY. As you can see SLV is flirting with a breakout from a long standing trend line in a tight bull flag pattern. Volume is tracking with heavy moves up and light moves down. We have a rising 50 day ready to make a golden cross. I like SLV to break out and move quickly to the upside over the next few weeks and perhaps even months. Gold...
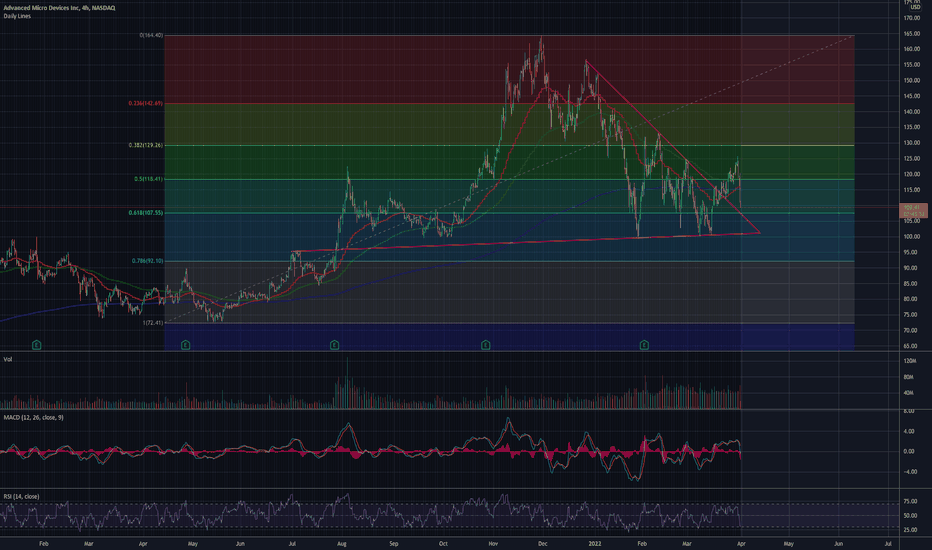
SMH up 33% in 21 trading days, and 14% in the last 2 days. SMH has not come back to its downtrend line with lots of air and gaps to fill below. AMD and NVDA up more than the index itself during the same time. As of the close semis are down just under 31% on the year. Semiconductor bear markets are much deeper and longer. Looks like the next leg down may be...
The move in the Dow over the last 21 trading days has come to the very top of its downtrend line up 5100 points or 18% since October 13th. Significantly overbought with many components up 30-50% in the same time. Book the profits and don't stick around too long. Happy Trading!
AAPL was precariously situated at the neckline of the head and shoulders pattern and ready to break before the release of the October CPI report yesterday morning which was 2/10ths cooler than economists had predicted at 7.7% (yes you read that right). This sent AAPL up 11% in two days. This move along with the move in semiconductors (14% during the same 2 days)...
AAPL is flirting precariously with a support level that has been in place since the covid bounce. It is the excess of the trillions of dollars thrown into the system. Like every other big cap technology stock AAPL should break its June low on this move down. $118-$120 should be a bounce area to $130 or so before it visits $100. Not trading advice
This chart says it all. The levitation act in the market is being driven by a few names that have too much weighting in the indexes. AAPL can not continue this ascent very much longer. It is overbought and has moved up $47 from the June low. Think about that a $47 move mostly uninterrupted. What goes up must come down. My hunch is very soon.
Perhaps. On the daily we have a divergenace and volume on Friday was capitulatory. I could see one more test of the lower end of the pocket and a reversal. Scary times. Be safe.
DXY has moved fast and furious and looks to be testing authority at 2016 and 2020 levels. Bumping up against Golden Pocket breakout. Look at 08/09 run before collapse. Overbought on monthly. Looking for correction.
This is setting up like the last silver run. Nearly identical patterns. Expecting SLV to outperform GLD the rest of their bull runs. Indicators nearly identical as well. NTA
I anticipate that history will repeat itself eventually when SLV finally takes off. Set-up very similar in terms of chart specifics including Fib levels. Patience required.
Chart extended on all time frames. Weekly looking to roll soon. This is up from the pandemic lows $200. Mean reversion coming. NTA
Looks like a breakdown could occur. Looking at least 92 which would turn this into a horrific looking chart! Be safe folks!
Follow-up to the hourly I just posted. Nice cup pattern forming. Volume picking up and indicators moving up. RSI in the 2010 ascent started sliding and I could see that happening again with higher highs. NTA
What appeared to be a H&S pattern a few days ago has started to look like a stock on the move back up. Indicators still good with a weekly close above last week's down week. Sure I would have liked volume to pick up this week, but market volumes were low in most parts of the market this week and the bid under the precious metals space looks like it could last a...
This could have gone either way today. Not sure if this is going to have any follow-thru but interesting to note the breakout from the flag with minors strong as well. They may try and push this before qtr end as it has been a very strong quarter for precious metals and miners. Indicators still strong.
If miners are going higher NEM is the lead horse. Strong day today after the bull flag setup we are seeing a cup forming which may include a handle or not. Indicators still looking good Mortimer!
Six up weeks on increasing volume followed by 1 down week on light volume. Held breakout resistance. Indicators looking up. Hi Ho Silver Away! Not trading advice.


