Expecting further upside after Tencent leaves Re-accumulation Phase (Trading Range) possibility entering in Mark Up Phase. Over the Re-accumulation range, stock showed the transition from supply dominated action to weakening of supply to demand dominated action. Stock is trading relatively stronger than the broad market (RS above zero), indicating strength in...
Dow theory continue to suggest weak/bearish technicals after last night's Fed announcement. Dow Jones Transportation (DJT) has broke below critical neckline (fell thru the Ice) as Dow Jones Industrial (DJI) broke its uptrend line. DJI breaking its neckline, with confirm US markets entering downline.
A quick summarized view. We are waiting for Supply Exhaustion. Usually, with the trading day displaying "low volume & small body" trading behavior, similar to 27 Feb 2021 and 24 Jan 2021. Once appear, traders may take a long position on bullish character (Bullish Candle with large volume) for swing trading. For long term position, we will need to monitor for...
Trade Plan, 1st Target price @ S$1.28 (Net HVN) Stop loss a@ S$1.13 (Below current HVN) Risk/Reward Ratio: 2.75x Technically, Stock is displaying bullish character (rally on increase vol and consolidates on reduced vol). Thus we have expectations of the breakout to materialise. Next HVN level gives us a RR Ratio of 2.75x with stop below current...
Sembcorp Ind (U96) traded above its consolidation range (JAC) today. A summarized analysis, we noted that supply has been weak throughout the 21 days range. We also noted that an early spring on 29 Sept. On the other hand, demand returned near to the end of the range, with Sign of Strength (12 Oct) and JAC today (15 Oct). Here's our plan: Entry: On Open Target...
Gold is expected to see further upside with 1st resistance at 1955, also a key resistance for gold, as the level being a previous consolidation area. We can expect further upside when gold breaks above 1955 with first resistance at 2000, next at 2089, previous high. The breakout is favored by Wyckoff traders as supply eased with demand building up, which lead...
Trade Plan, Target price @ US$293 (Previous High) Stop loss a@ 274.50 (Below17D SMA) Technically, Stock is consolidating within a triangle pattern with expectations of bullish breakout. Fundamentally, Beneficiary of Work from home trend and a recovering economy. PE at 25.8x and Div Yld at 2.15%. Company Background, Operates 2,291 home depot stores offering...
ES1 (S&P 500) broke out of its down trendline and then saw Sign of Strength (SOS) , breaking above its resistance. With the bullish character , we expect the current short term demand>support situation to persist, trading towards 2850 resistance area (FIbo 61.80% area and previous support level. However, 1 sign of cautious is the volume . We like to see...
Xiaomi stock price jumped across the creek as the company announced the launched its low cost 5G phone today. Related Article Today's action is different from previous rallies as price broke above a significant resistance level that we call The Creek, a resistance level within the accumulation set-up. With this break out, we expect stock price to move into Mark...
DJI (4hrs) formed a hammer after touching its current uptrend line. With the next candle breaking above the hammer's we have expectations of demand>supply. Thus, we have short term bullish bias that DJI will trade upwards to test its Gap at 26,420 level which is also a confliuence of the 50%-61.8% zone. Stochastic indicator has also exited its oversold zone...
Gold is expected to be trading in re-accumulation instead of distribution in view of a "Spring" event. Spring is a exhaustion of supply, indicating demand is expected to be back in control. A breakout from the creek (resistance), we will expect Gold to trade further. 1st TP: 1,550 level (Previous high +2.618% Fibo) 2nd TP: 1,600 (Whole Number Effect + 4.236$...
NASDAQ:AMZN failed to break above its Upward trendline on 3x attempts. Negative relative strength and FFI indicator potentially points to stock's further weakness. 1st target price at US$1,760 and 2nd target price at US$1,675. Break above US$1,835 will falsify the above analysis.
BTC Entering Mark Down. Here are some of the keys levels to watch for rebound. In view of key Fibonacci level 161.8%, BTC may expect retracement rally at 8,400 level, watching for price divergence or neutral candlestick pattern.
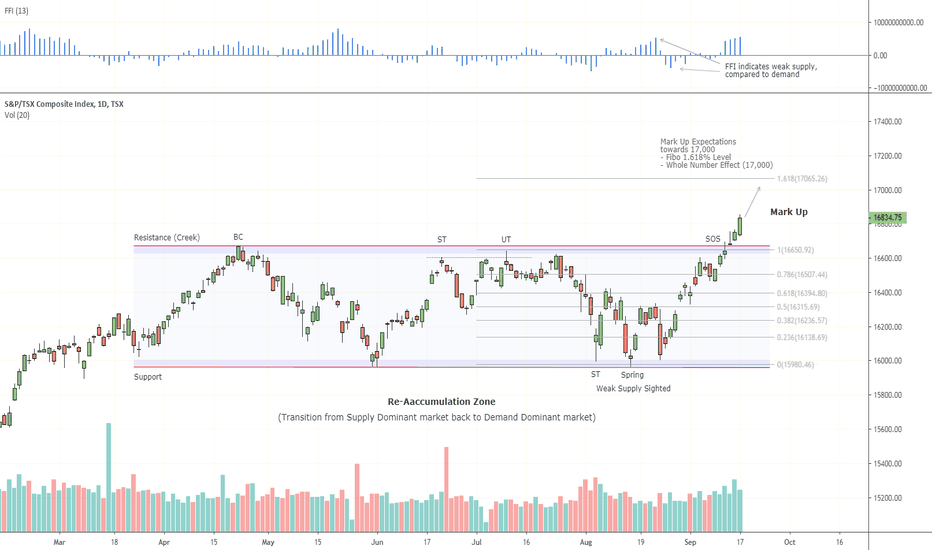
TSX jumped across the creek (out of the re-accumulation zone). Currently trading in Mark Up Phase. Target Price: Price is expected to trade towards 17,000, set based on confluence of Fibo level and whole number effect.
OANDA:AU200AUD is expected to trade towards 1ts support, 3.82% Fibo retracement after breaking down from the lower trend line of the upward trend channel. Overhead support-turned-resistance (LPSY) also created additional layer of difficult for the index to trade higher. A break above 6,765 wil falsify the analysis.
Supply continues to dominate recent trading as index broke below another support level. As long DAX does not close above current 11,445 support, index will is expected to trade towards 11k. Stop for current analysis at 11,860.
BITFINEX:BTCUSD is in a major consolidation, break above or below the pattern will see BTC retesting its range top/bottom. FFI's consolidation is also suggesting market participants watching from the sideline. Breakout from the 9,000-13,800 will see further directional move.
- Downtrendline broken - MACD Momentum change - Expected to retest key downward trend line


