Technical Support: Explanation on chart Key Risk: SGX:T39 needs to break long term down trend line
TVC:UKOIL is seeing a Bearish Harami pattern as price tried to retest US$80.00 level. The failure to break previous resistance coupled with bearish candlestick pattern signals that TVC:UKOIL is experiencing weakness and will expect to retrace and re-test trendline at US$75.00. Next target at US$72.00.
If current trading maintains and STI closes wit a Hammer pattern. STI is high a high probability of rebounding and testing its immediate resistance zone at 3,340-3,360. Currently STI is trading at a support-turned-resistance level of 3,270. A break above 3,360, will see TVC:STI trades towards 3,400.
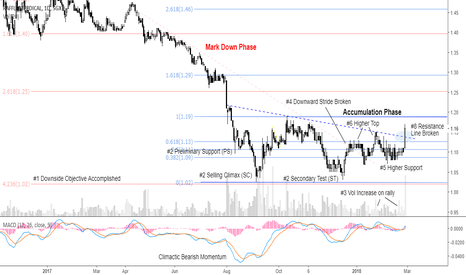
I had some time this evening, thus, decided to conduct the Wyckoff Accumulation zone (Buying Tests) analysis on the stock. We expect the stock to mark up from here with target price at S$1.29. Stock's price action has passed 7 out of the 9 Wyckoff Method test as follows. Buying Tests (Passed) 1. Downside price objective accomplished 2. Preliminary support,...
SGX:CH8 Supporting Observations: 1) Multiple Distribution Signals - Uptrend Stride Broken - Uptrust observed - Test observed 2) HA Colour Change (Momentum) Risk: Stock is losing RS but overall is still stronger than STI
TVC:DXY fails to break 95 on 3 attempts. Thus, demand is not supportive of a higher DXY. index is expected to retest and retest support at 93. Momentum indicator, MACD, is already bearish and has just witnessed Bearish Divergence. MACD is expected to trade towards its zero line. Technical view is negated is DXY closes above US$95.50.
Compares stock's performance against another stock comparing their performance with their long term moving average.
Recent sell off saw Three hammer candlesticks in a row, signs of buying within selling. Thus, we expect a short term rebound at 0.382 retracement level back towards 25,200 zone.
TVC:HSI has broke a significant 1-year trend line. We expect the index to trade lower towards 28,000-28,200. 28000 is significant also, supported by a long term trend line and fibo 1.618% projection and whole number 28000.
FB has retreated close to 10% within 2 days amid its Data Leak scandal and seems not ending on the selling. However, taking a rational look at the stock's technical, the stock has traded steeply out of the lower bollinger band with climactic volume observed. These observations coupled with a long-legged candle could suggest that selling has been may be over done...
Upward Trend Momentum with Fibo 161.8% Target.
Price consolidated in a re-accumulation zone since early Aug with resistance at US$53.00. Earlier yesterday, we finally saw the price did a breakout (SOS) with oil closing above US$53.00 on the 4-hourly chart and continue trading higher above the level. This gave us conviction that oil is in a Mark Up phase with 1st objective set at US$54.50. The 1st objective...
Poised for Mark Up from Consolidation, with Target at US$20,000. Trading below 15,500 signals Mark Up failure.
Confluence of technical factors which include Hammer pattern, Outside Lower Bollinger Band and Resistance turned Support Zone likely to lead a swing back towards to S$26.30-S$26.50 zone.
As HSI was not able to clear the 31350 Gap resistance, the index is expected to experience weakness, which would see price retrace back to the re-test 50% fibonacci retracement level.
HKEX:939 is expected to move towards first technical target of HK$8.50 after consolidating in a Descending Triangle like pattern for 3 months. The supporting technical includes decreasing volume as price makes bearish downward movement. Both technical indicator MACD and Stochastic are seeing possible signs of bullish reversals.
U11 failure to close the gap indicate strong selling within price action. U11 set to retest lower channel at S$27.65. Failure to hold will see stock price mark down towards fibo downward project of 4.236%. MACD momentum is bearish.


