BullRingAnalysis
Apple seems to be reaching its major resistance trendline. Seems to be overbought with higher RSI and Simple moving average. Apple, in general, follows this particular channel that I posted not too long ago. Since its the same channel, historical patters will show a bearish outlook of the stock due to its current price mark.
MACD crossover on the day chart- lower levels heading into July RSI at upper threshold MA's at highest level in stock history BULLRINGANALYSIS
Currently at major support zone MACD Crossover into positive zone on D Chart RSI currently at an oversold level, historically jumps BULLRINGANALYSIS--> FOLLOW FOR MORE POSITIONS
RSI on downturn w/ 4 hr chart. MACD moving to negative crossover as market reached relatively new highs Price is currently at a standard deviation above mean, pushing price lower in the short term
Channel reaching major resistance zone, RSI at one of SPY's highest levels after a single week of massive gains. IG: BULLRINGANALYSIS
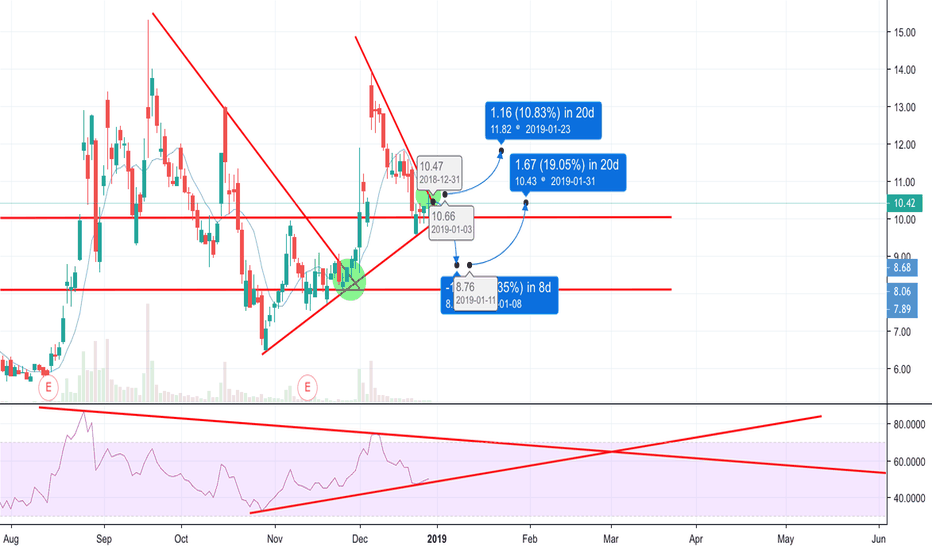
IG: @BULLRINGANALYSIS Tlry is a very interesting pick here. Early stages of company growth but, descending triangle pattern is meeting major resistance level. Bullish signal from this pick, but could be interesting to see what happens at this intersection point. RSI is also in interesting position for growth as well. not financial advice
IG: @BULLRINGANALYSIS Triangle Pattern forming on short-term XRP Charts w/ still an upward trend in the long term. Interesting development here as RSI is in good position for growth on the 4hr chart. Likely to see a small drop as it reaches the top of the channel and then an increase when it reaches some key support positions. not financial advice
IG: @BULLRINGANALYSIS Easy to say/noted that AAPL has been following an upward trend & triangle pattern for some time now. The beginning of 2019 will be interesting for apple to say the least after massive drop in late 2018. Despite the drop, Apple has MUCH room for growth. P.S : RSI Levels in good position for upward movement not financial advice
IG: @BULLRINGANALYSIS seeing channel breakouts over the past few trading months RSI is is good position for forward growth in the short term we can see this price drop to it's second support level (upward trending), and then possibly bullish movement Increase in adoption as legalization increases in early 2019. Analyst EPS estimate increase in future not...
IG: @BULLRINGANALYSIS Despite government shutdown leading into the beginning of January, trend shows price decline leading into the first week or so of 2019. RSI is following declining trend line earlier support levels flipping into resistance levels I would watch for these support/resistance levels indicated on the chart, for we can see fluctuations as DJI...
IG: BULLRINGANALYSIS upward trend on RSI Cross on diverging triangles MA crossover into bull territory Follows DJI fairly close. Short term decline in realm of possibilities, then small pump upward not financial advice
IG: @BULLRINGANALYSIS Why do I see a short position coming ahead? MA Crossover on the 1w chart Ascending wedge forming -->going into two different resistance levels where price statistically declines patterns are starting to form, dating back to early & mid 2018 months Higher RSI levels relative to average IG: @BULLRINGANALYSIS
MA Crossover 4hr favorable RSI position for growth Long position in the short run BINANCE:MDABTC
MA crossover on the 4hr/1D Chart RSI in optimal buy zone MACD swing into bull territory BINANCE:XRPBTC


