USDJPY appears to be unfolding a classic ABC correction following the completion of a 5-wave impulse pattern. Price action recently bounced off the 0.618 Fibonacci level (~140.62), but faces resistance around the 0.5 retracement zone (~144.70), where price is currently testing. Key levels and confluences: 🔹 EMA cluster around current price 🔹 Potential descending...
The Australian Dollar (AUD) has significantly diverged in performance across major currency pairs since 2019. The AUD/JPY (yellow line) stands out with a strong +14.01% gain, reflecting both risk-on sentiment and yen weakness. Meanwhile, AUD/USD and AUD/CAD have both suffered steep declines of -10.24% and -8.85%, respectively, underlining AUD’s vulnerability to...
Everything according to plan!!! We see more downside potential for the Oil market that could reach $40 area
Big Resistance up here, but if we can close above EMA200, I think we can resume higher and maybe to a new all time high...let'see
Too good to be true??? Let's see what is going to develop
On the daily chart, an interesting potential bearish head and shoulders formation is developing. If confirmed, it could lead to a downward move, completing a minor degree wave iv before resuming the broader uptrend. I expect prices to retrace towards the 1.1204–1.1105 area.
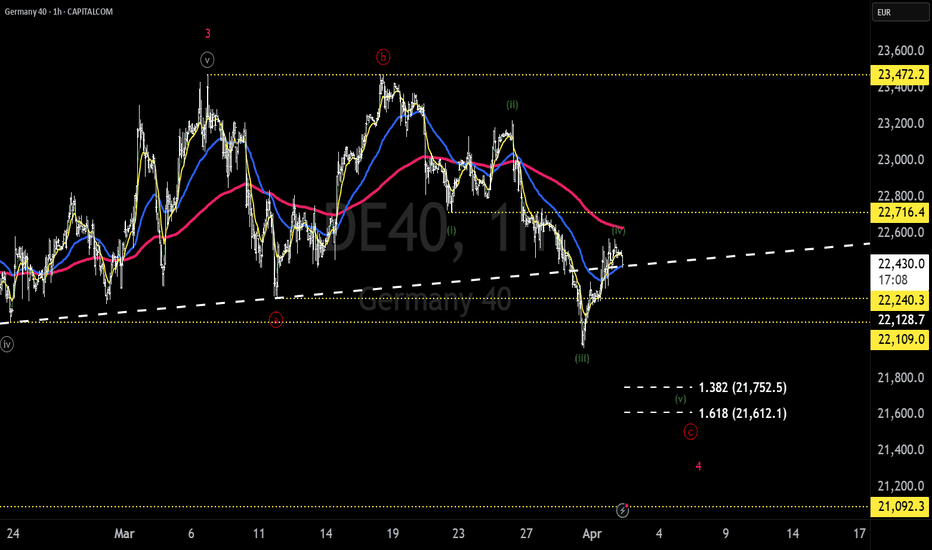
Let’s see if this Elliott Wave count plays out as anticipated. 🔸 Invalidation Level: 22,716.4 (CFD – GER40, Capital.com) 🔸 Downside Targets: 21,752 and 21,612 A sustained move above the invalidation level would negate the current bearish wave structure, while continued weakness below recent swing highs keeps the downside scenario in play.
I'm currently anticipating further strength in the euro against the dollar, with the potential for an impulsive upward move targeting at least the 1.1312 level. The current wave structure suggests a bullish count is still valid, provided that 1.0528 holds as support. A decisive break below this level would invalidate the bullish scenario, opening the door for...
Analyzing the 60-minute chart, I believe there is still room for further downside in order to complete what I interpret as a five-wave structure within a larger corrective wave C, which itself forms part of a broader wave 4 of higher degree. This corrective phase appears to be unfolding within a clearly bullish long-term trend, as confirmed by the weekly chart,...
FDAX 60MIN CHART Let's see if one of my favourite pattern is going to take place on DAX
ChatGPT ha detto: GBP/USD (Futures Contract) – Weekly Elliott Wave Analysis GBP/USD found support around the 1.2097 level, initiating a rally that is currently facing resistance near 1.2900. Based on Elliott Wave structure, this resistance zone is expected to trigger another corrective decline, potentially driving prices toward the 1.1923 - 1.1566 area before the...
Crude Oil has once again found support near the $65 area, initiating a modest rebound. This bounce may extend toward the $72 level, which I view as a potential area of interest for initiating a short position. Should price action reach that zone, I would look to enter short with a defined target range between $50 and $42. In this scenario, the stop loss would be...
A potential trade setup for the upcoming week on DAX Futures presents an opportunity on the short side. Analyzing the price action, we observe a bearish impulse wave that started at 23,504 and dropped to 22,263, forming a clear five-wave structure. The subsequent three-wave correction suggests a temporary retracement rather than a trend reversal, implying that a...
From a technical standpoint, I believe the DAX has formed a medium-term top at 23,504 and has begun a 5-wave structure that is likely completing wave A of an A-B-C correction within a larger 4th wave. On an hourly basis, the trend has shifted, and I consider any retracement or bounce as a solid opportunity to take a short position. The structure indicates that we...
Today, we will analyze the Australian Dollar Futures. On the weekly chart, we may already be witnessing the end of the corrective bearish movement, as we have seen a break of the previous lows at 0.6184. Technically, we have also closed above the EMA5 and EMA10, which suggests potential bullish momentum. However, I believe it's still premature to call a long-term...
The Euro is gaining strength against the U.S. Dollar, and the technical structure on the weekly chart suggests a strong impulsive wave to the upside 📊. 🔍 Key Elliott Wave Perspective: The current bullish move appears to be part of a larger impulse wave, targeting the 1.2573 - 1.2977 zone 🎯. However, this bullish outlook remains valid as long as the market holds...
The E-mini S&P 500 (ES) may have printed a temporary medium-term top at 6167.25, potentially initiating a Wave 4 correction (yellow circle). If this count holds, we could see prices retracing toward the 5115 area. 🔹 Key Levels to Watch: ✅ Bullish Bias: The trend remains firmly bullish until we start trading below 5715 and break the ascending channel's...
Gold remains well-positioned in a strong bullish trend, although prices have struggled to break above the rising trendline of the ascending channel. Considering that this move could represent the fifth wave of a larger-degree Elliott Wave structure, I’m on high alert for a potential correction. A pullback could bring prices back toward the $2,600 area. However, as...


