Cincinnatuus
So much excitement over the price action in Silver, with the nice move on Friday. So I figured I’d post a short-term chart, so at least the people who look at my stuff won’t get burned. The big picture is this is a C-wave sell-off within a larger C-wave sell-off, to finish off an even higher degree b-wave. So, expect prices to drop pretty relentlessly with some...
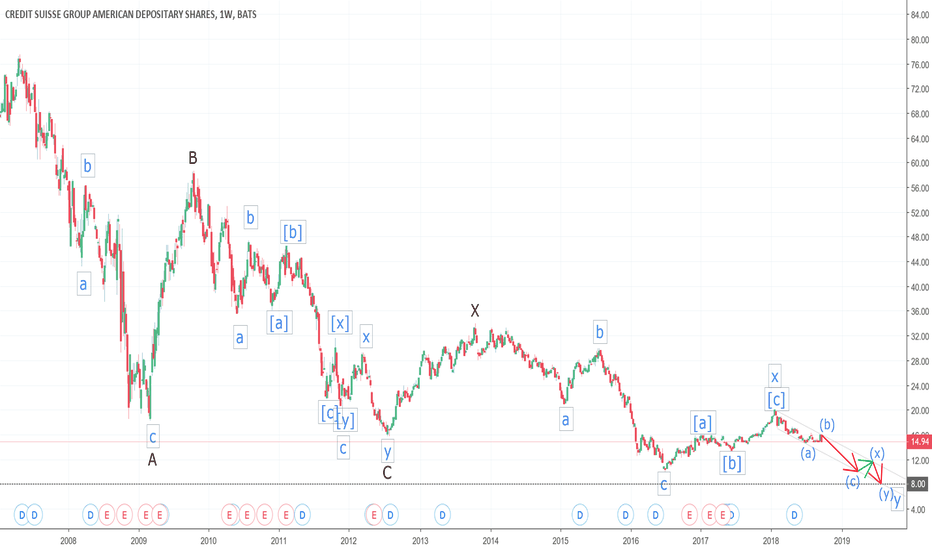
Gee, Imagine that, another European Insolvent Bank Walking… Short Term, Credit Sleaze looks like it is working its way down to $8. Long Term, Credit Fleas is projecting a massively negative valuations, complements of the massive pile of derivatives they like to play with…
You ever see Weekend at Bernie’s? A lot of parallels here in that the ECB has found DB involved in all kinds of financial fraud, but after arriving in Draghi’s Ctrl-P Party in Paradise, the ECB finds Doobie Banks lifeless body. To the ECB’s amazement, the guest are too engrossed in their partying to notice the bank is dead, with the dopey grin from a fatal...
Your main take-away is the Euro is exhibiting corrective behavior. Corrections go down. All currencies eventually die, especially if you let Draghi print it relentlessly. The Euro went public in 1999 as a monetary currency instrument, and if the Europeans want it to survive, they are going to have to make some changes. I recommend the Germans stop using the...
The Chinese CNY has further to devalue against the USD as a result of the ‘Trade War’. With the Chinese providing a floor underneath Gold, buying when it gets to their price, there is thus further to go in the sell off of PM’s and their mining stocks.
A double Zig-Zag in the (c) – wave would achieve a measured move equal in length to the (a) – wave.
The Seven Year Cycle Bottom should have been in December of 2015. If we drop below that level here, that implies this seven year cycle in Silver will be bearish with a lower, low in 2022. The implication would be that a much longer term cycle will have ended, and a very long term Bull market will start. This makes rational sense because the statistics show that...
When you start looking at the down side price potential of Silver, the very real possibility that the December 2016 cycle low could be taken out becomes evident. Here we have a measured move of the A-Wave of the correction taken from the top of the B-Wave triangle projecting a price point at 13 & 1/8th. You could also project the height of the B-wave triangle...
Updated view, with what seems likely price path, based on deep retracement of d-wave so far. Second waves only typically retrace 50 to 61.8% of first waves, and we're in that range already now. Looking for other dollar denominated assets to complete their patterns and reach various price targets, so expecting price action to take a while to play out. At these...
Update 9/1/18: Gold (Precious Metals) Miners Sell Off Fourth Wave corrective bounce continues. Likely PM's are tied to the dollars bounce, and will keep selling off until it tops...
Trying to get a sense when this second wave back up in the DXY could complete. There appears to be a lot of correlation right now between the DXY, emerging markets, the Chinese Yuan, and Precious Metals. The DXY appears to be forming an Ending 5-wave Terminal Pattern to complete the y of the boxed b-wave. Thinking it's likely the DXY trades up to the Fibonacci...
This Elliott Wave count for the 2nd wave of the correction shows how to use a, b, c's and x's to label the waves, due to the fact that there is so much overlap between waves. A lot of Technical Analysts try to label upwards corrections with numbers 1 thru 5, and wind up showing the fourth wave trading in the range of the 2nd wave. It's an Elliott Wave rule that...
Looking at the Gold Miners ETF GDX as a potential investment. Seasonally, PM's tend to bottom in July and December, but July didn't work out this year! So the market is showing what looks like a descending horizontal triangle targeting the point 16.30 which would be a price drop from the end of the triangle equal to the height of the triangle. The implication...
Ten Thousand Foot View of how I'm currently perceiving the US Stock Market. The implication of finishing up a Grand Supercycle Wave 'III that started back in 1974 is that a Grand Supercycle Wave IV will then follow it. With Wave II in the 1960's being a triangle, the implication is that this Wave IV will either be a flat or a sharp. The A-B-C pattern would be a...


