Things are historically bad. The biggest reversal you can imagine. The economic situation has continued to decline. How are you handling this? The tariff make the headlines but why is the 10 year yield behaving this way. Maybe a flight to safety. This is crazy this nuts. I can't even believe this is happening.
Yet another sign that we are in a down market. Death cross are always more reliable. This however coupled with everything else is very negative. What do you guys think? Is this the bear market?
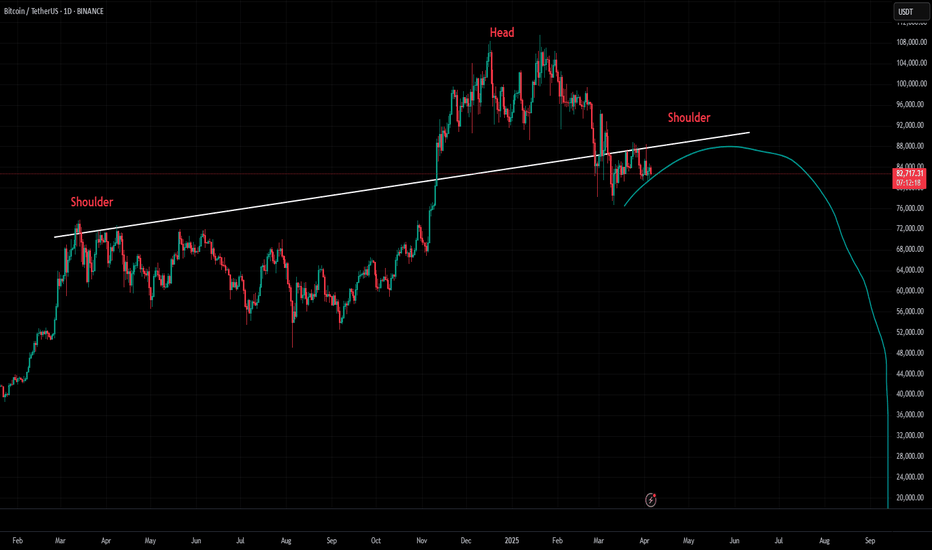
This very grim outlook shows a forming Head & Shoulder patter for BTC. The Trade War is in Full Swing !! It light the powder key that had been forming for a long time. There are many theories about why this is happening. What is relevant beyond those reasons is that the markets will probably crash hard. The situation will probably get out of hand. So far...
This image shows how much BTC has gone down in the last year and a half. They have been similar in magnitude. Could this be the bottom of the market ? Could be the start of the bear cycle. Most crypto traders I know are very ready to get out if there is one more leg to the cycle. That being said once greed hits hard those same people may change there mind. lol....
The markets got absolutely hammered !! It looks like that there may be more down side left to around 74 K which then would be a good re-entry point. It is looking very bleak out there right now. Some say that bottom for BTC has happened around 89 K but I think it will continue down for the foreseeable future. What do you think will BTC re-bounce or will it...
In this chart I noticed the 10 Year Bond is forming a Head & Shoulders Pattern. If this plays out it would be Bullish !!! Typically when the 10-Year Bond retraces asset prices go up. Aka Prices increase to the upside !! The RSI is also bouncing from lows nearly reaching the oversold level but not quite. It's possible that there is more downside left on the RSI...
I have covered in this post what could be the BTC cycle top. Interesting it looks like in October. Many people said that February is typically a bullish month for Crypto. Not so far !! We were in a similar price point in December 16th of 2024. This drop is clearly Geo Political risk. AKA the Trump tariffs both Canada and Mexico have retaliated against those...
The markets are on fire today with the S&P 500 doing amazing things !! So many people called the top in November and December. They were wrong !! Looking forward to this crazy year continuing !!
In this chart I talk about the pattern in the S&P . There is just no way to know where it will end up. What do you guys think? Where will it go in your opinion ??
This weekly chart highlights Brett's textbook bounce from support , reinforcing my high conviction that Brett will perform well this bull cycle. There are many reasons behind this bullish outlook. If you're interested in understanding meme coin trading strategies, take advantage of my free course—a limited-time offer! What do you think about these levels? Are...
I find it hard to argue with this chart. Clearly we are on a knifes edge. It may be time to de-risk and lock in profit. PROCEED WITH CAUTION !!!
In this chart we see that if Super can close on the weekly above the lower bound. It is bullish for the Super token. Make sure to watch my video on the top 4 sectors. Let me know if you agree with this technical description or what you would do to make it better. Crypto Andy Virtual Bacon
In this chart we see that if Super can close on the weekly above the lower bound. It is bullish for the Super token. Make sure to watch my video on the top 4 sectors. Let me know if you agree with this technical description or what you would do to make it better. Crypto Andy Virtual Bacon
Crypto Andy Rekt Capital In this chart I cover Rekt capital video on the price chart that needs to be broken for BTC to continue bull trend. The red and green parallel channels are in the monthly view for BTC. The parallel channel on the near term BTC price is in the weekly view. If these levels are not retaken then we would be in a bear cycle most likely.
Crypto Andy Rekt Capital In this chart I cover Rekt capital video on the price chart that needs to be broken for BTC to continue bull trend. The red and green parallel channels are in the monthly view for BTC. The parallel channel on the near term BTC price is in the weekly view. If these levels are not retaken then we would be in a bear cycle most likely.


