Crypto_Moses
PlusIs Justin Sun setting us up for FOMO with TRX? Daily is accumulating. is it for an explosion up, or down? I have no additional information than what's portrayed in the picture. Plenty of room for MFI, break out is another tap of the upper BB Band, and momentum is clearly ready to just go up. my guess is this is a breakout trade already started but who knows. So...
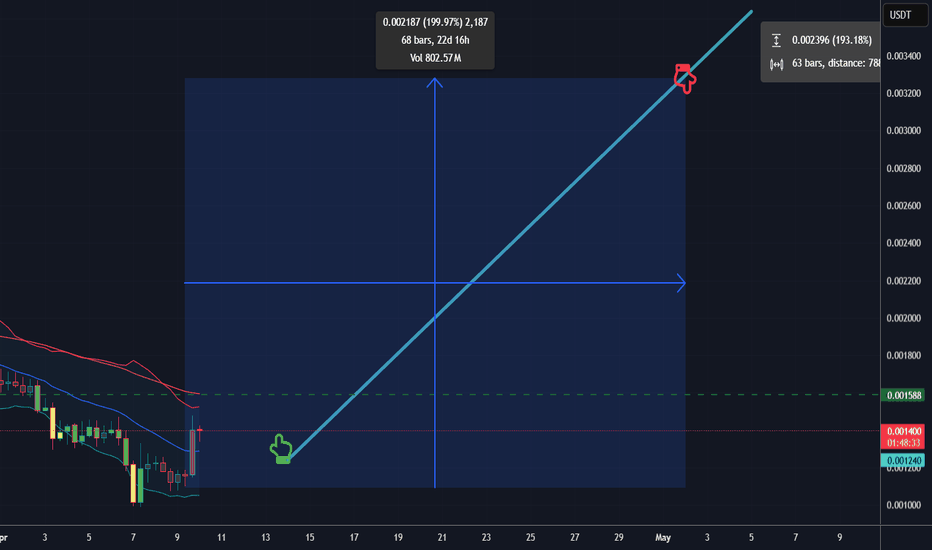
Dog is poised to recover well from the bottom. It was way over sold. At this pace it'll naturally run into the weekly basis or mid BB Band, which I estimate is around May. If you bought around the range where the buy signal is, you'll probably be all right to Hodl long term. However, without a Tier 1 listing I suspect it will continue to fully retrace. So, for now...
Yesterday, the Bybit hack occurred, and at the time, it was the biggest hack to a crypto exchange ever. Unfortunately, the hack happened during an accumulation phase of the price range. This makes me lean towards a breakdown, due to liquidity changes being too dramatic, too fast. I’m not 100% certain, but that’s my gut feeling. I expect a breakdown to the bottom...
On the 6‐hour BTC/USD chart, price action has been trading within a clearly defined descending channel (shown by the dotted diagonal lines). Within this channel, we see lower highs and lower lows forming, which suggests a short‐term downtrend. Meanwhile, the blue moving average (MA) line in the middle of the chart is acting as a dynamic support/resistance...
With the momentum, volume, and the Bollinger Bands across all views. This will give the most accurate picture of the situation. 1. Momentum Overview (6-Hour, Daily, and Weekly) In the 6-hour chart, we see alternating orange and red bars. This means there is short-term bullish momentum, but the volume is dropping. This shows that the market is moving up but...
The 12 hour has the price of bitcoin pretty much topped out (in the BB Band) at the same time it's bounced off this developing wedge pattern. A break above and out the wedge would negate the wedge and mean the uptrend is just that, a trend. However, as long as that wedge develops, and breaks down, it could be something the bears will utilize for a possible...
If we follow September 2019 we could see as low as 23k. The good news is the bounce will be nearly a full retrace. So long the bounce, but you can short resistnaces probably till next year. Going to be a while before it's up only again. But definitely up only from the yearly low in 2024.
Bitcoin had its first major correction off the low from 15k, and high of 31k. The correction from 31k has been really deflating for some, but whever support is found, it's hard not to remember that BTC has pretty epic bull runs. A close above resistance which is represented by the slow moving average price is coming up on would be a huge indicator short term...
Nice support Range Trajectory incoming. Ideally we bounce in between the two lines below.
Got a sale signal on the 6 hour according to the Hybrid Keikin Kaufman Strategy. Zoomed out this looks right. Not sure where a local bottom would be but the 3 month trend is still up so is it time to buy the dip for a scalp at least? Sale in May and Walk away, but buy dips till it gets to may??? That's how it goes right? Right?
Let's look at the short term: Above the horizontal red line, I'm bullish and below it I'm bearish.
In my previous Idea it looked like we were going to get a copy and paste of the previous move up (thumbs up). But, today the move up failed. Now, we've lost the volume based momentum, and the 13 EMA is acting as resistance. We need to regain the 13 EMA fast; but, it's been failing for 3 days now, and I fear the bears are in control. Onchain inflows peaked today...
No sale signals yet so think we're good for one more bounce into resistance. Looks like convergence of moving averages there will eventually be more donw just because the longer term ones are still pointing down, but channel is clearly a reversal one so being overly bearish hear could be a potential trap, especially if we break into the new second tear channel...
Sell at $.57 And buy back at $.4401? Is that red line a trend line that’s going to hold? Time will tell.
ICX had a double bottom at $.18 and $.28 since the bottom. Where’s the next double bottom? Here’s a scenario anticipating the same kind of climb.
There's a confluence of a cup and handle and an accumulation against the 100 day SMA. Support is great on the 200 day SMA. My hunch is a weekly close above the 100 and IF there’s no pump yet, it’s time to buy hard and fast. Could break down too. Triangle is the key.
If a four hour candle closes below that blue 9 day moving average you can expect the bear flag to complete and for the price action to break below the flag. Looks like if that happens there’s much more further down side action in the near future. A break up and out of the flag is necessary soon!
It appears to me this whole range has been accumulation. The question is, is this accumulation to continue the longest term bull market the world has ever seen? Or, does this trend reflect accumulation for shorter term correction, a precondition for something like a recession if you will? Notice the arbitrary trend line is being tested, and the median price line,...


