Cryptokijker
SUI/USDT 1H: Markup Phase – Long Setup Above $3.60 🚀 Follow me on TradingView if you respect our charts! 📈 Daily updates! Current Market Conditions (Confidence Level: 8/10): Price at $3.60, showing strong bullish momentum following recent accumulation phase. Hidden bullish divergence on RSI confirms internal strength and supports upward continuation. Smart...
ADA/USDT 1H: Markup Phase – Long Setup Above $0.7080 🚀 Follow me on TradingView if you respect our charts! 📈 Daily updates! Current Market Conditions (Confidence Level: 8/10): Price at $0.7086, showing neutral-bullish structure after breaking above previous high. Hidden bullish divergence spotted on RSI, supporting bullish continuation bias. Smart Money...
DOGE/USDT 1H: Accumulation Breakout – Long Setup Above $0.1790 🚀 Follow me on TradingView if you respect our charts! 📈 Daily updates! Current Market Conditions (Confidence Level: 7.5/10): Price at $0.17931, showing neutral-bullish structure after recent breakout above PDL. Hidden bullish divergence spotted on RSI, indicating strength beneath the surface. ...
AIXBT/USDT 1H: Markup Phase – Long Setup Above $0.1540 🚀 Follow me on TradingView if you respect our charts! 📈 Daily updates! Current Market Conditions (Confidence Level: 8/10): Price at $0.1553, showing strong bullish structure after breaking above Fair Value Gap (FVG). Hidden bullish divergence spotted on RSI, reinforcing bullish continuation potential. ...
SOL/USDT 1H: Distribution Phase – Short Setup Below $150 🚀 Follow me on TradingView if you respect our charts! 📈 Daily updates! Current Market Conditions (Confidence Level: 8/10): Price at $148.45, showing neutral-bearish structure after rejection at previous candle high (PCH). Hidden bearish divergence visible on RSI, signaling potential downside...
XRP/USDT 1H: Accumulation Phase – Long Setup Above $2.28 🚀 Follow me on TradingView if you respect our charts! 📈 Daily updates! Current Market Conditions (Confidence Level: 7.5/10): Price consolidating at $2.29 with neutral-bullish structure. Hidden bearish divergence appearing near premium zone, caution advised. Market Makers likely accumulating within...
PEPE/USDT 1H: Bullish Structure – Long Setup Above 0.000089 🚀 Follow me on TradingView if you respect our charts! 📈 Daily updates! Current Market Conditions (Confidence Level: 8/10): Price broke above equilibrium (0.000089), confirming bullish market structure. Hidden bullish divergence spotted on RSI, suggesting momentum continuation. Market Makers likely...
ETH/USDT 1H: Bearish Structure with Potential Bounce – Long Setup from Discount Zone 🚀 Follow me on TradingView if you respect our charts! 📈 Daily updates! Current Market Conditions (Confidence Level: 8/10): Price at $1,796.97, currently bearish after breaking equilibrium zone. Hidden bearish divergence visible on RSI, suggesting weakening bullish...
🚀 Follow me on TradingView if you respect our charts! 📈 Daily updates! [ b]Current Market Conditions (Confidence Level: 8/10): Price at $94,627, showing strong bullish momentum with a clear structure of higher highs and higher lows. Hidden bullish divergence spotted on RSI, indicating potential for continued upside. Market Makers appear to be...
BTC/USDT 1H: Double Top Reversal – Short Setup Below FWB:88K 🚀 Follow me on TradingView if you respect our charts! 📈 Daily updates! Current Market Conditions (Confidence Level: 8/10): Price at $87,146, showing bearish momentum following a confirmed double top formation. Hidden bearish divergence on RSI, with lower highs while price made equal highs—classic...
DOGE/USDT 1H: Bullish Momentum Holding – Can $0.182 Be Reached? 🚀 Follow me on TradingView if you respect our charts! 📈 Daily updates! Current Market Conditions (Confidence: 8/10): Price at $0.1752, showing strong bullish momentum. No clear divergences present on RSI, suggesting sustained strength. Market Maker accumulation visible, confirmed by a recent...
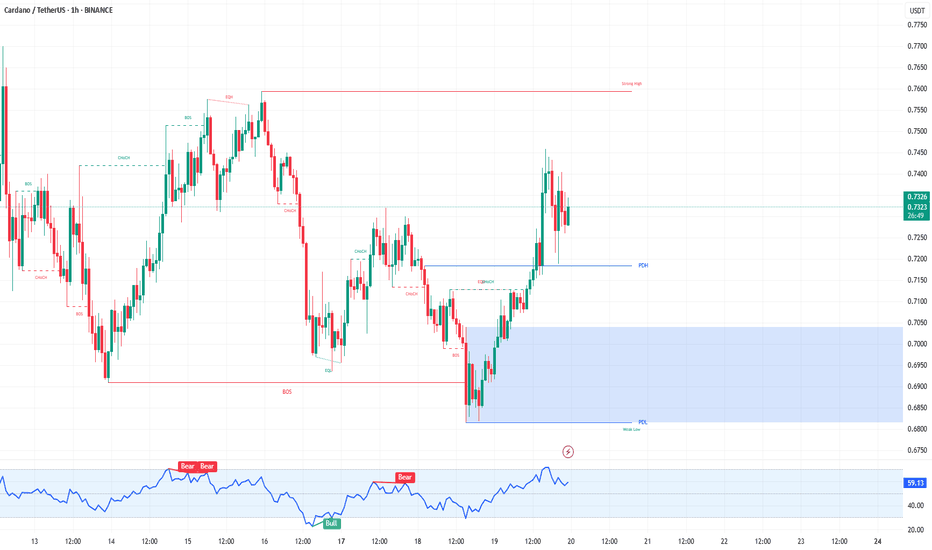
ADA/USDT 1H: Accumulation Phase Holding – Can $0.760 Be Reached? 🚀 Follow me on TradingView if you respect our charts! 📈 Daily updates! Current Market Conditions (Confidence: 7/10): Price at $0.7331, currently consolidating after a breakout. RSI momentum is building from mid-levels, indicating increasing strength. Hidden bullish divergence forming on the 1H...
SOL/USDT 1H: Bullish Trend Holding – Can $137 Be Reached? 🚀 Follow me on TradingView if you respect our charts! 📈 Daily updates! Current Market Conditions (Confidence: 8/10): Price at $134.34, confirming strong momentum and trend continuation. RSI at 72, indicating overbought conditions, but trend remains strong. Hidden bullish divergence observed on the...
AIXBT/USDT 1H: Accumulation Complete – Bullish Breakout Targeting $0.1200? 🚀 Follow me on TradingView if you respect our charts! 📈 Daily updates! Current Market Conditions (Confidence: 8/10): Price at $0.1023, confirming a clear breakout from the accumulation zone. RSI at 61.27, indicating bullish momentum with room to push higher. Hidden bullish divergence...
LINK/USDT 1H: Bullish Breakout – Targeting $15.45? 🚀 Follow me on TradingView if you respect our charts! 📈 Daily updates! Current Market Conditions (Confidence: 9/10): Price at $14.77, confirming a strong breakout above resistance. RSI at 66.12, signaling bullish momentum with room to push higher. Clear market maker accumulation pattern, supporting a...
PEPE/USDT 1H: Testing Resistance – Can Bulls Push Toward 0.00000780? 🚀 Follow me on TradingView if you respect our charts! 📈 Daily updates! Current Market Conditions (Confidence: 7/10): Price at 0.00000734, currently testing a key resistance level. RSI at 54.41, indicating neutral conditions with room for further upside. Clean order block formation at...
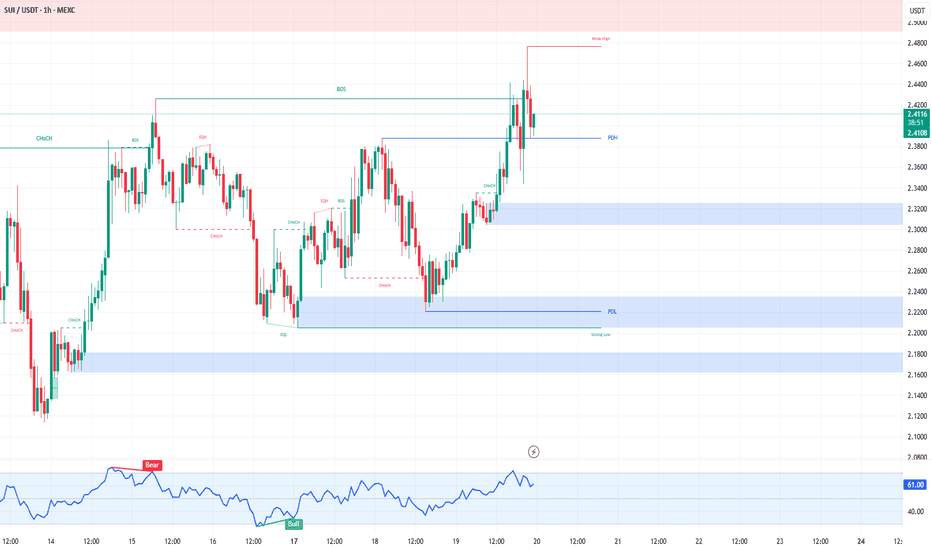
SUI/USDT 1H: Bullish Breakout Confirmed – Can $2.65 Be Reached? Current Market Conditions (Confidence: 8/10): Price at $2.40, showing a strong breakout from the accumulation zone. RSI at 60.41, indicating bullish momentum with room to run higher. Clean break above $2.35 resistance with strong volume confirms bullish intent. Hidden bullish divergence...
XRP/USDT 1H: Bullish Breakout Holding – Can $2.80 Be Reached? 🚀 Follow me on TradingView if you respect our charts! 📈 Daily updates! Current Market Conditions (Confidence: 8/10): Price at $2.51, confirming strong bullish breakout. RSI at 68.91, approaching overbought territory but still has room for continuation. Clear order block formation at $2.35,...


