DollarBob
I can see reversal pattern H&S on the chart.
It looks like an ascending triangle pattern. I'm 65 % up and 35 % down in my mindset now. But BTC 2.74% haven't done some big move for a long time so we can expect something.
Digibyte daily chart shows us a great opportunity to buy DGB. If you trust this cryptocurrency, this is the best time tu buy. DGB is now oversold on RSI and MACD. DGB has very strong structure on chart. DGB is very popular crypto asset of traders and hodlers.
Yea, I think short trend is continuing. Check out MACD, price is in a channel and weekend is ahead of us (weekend means drop). We'll see what Chinese do with BTC. But if BTC will brekout from that channel we have still many strong resistence for BTC. BUT look at BTCUSD daily chart. It's just oversold, price on support, RSI oversold... we'll see....
NZDJPY is in falling wedge and as you can see RSI is oversold again. The trendline of falling wedge has to be unbroken.
If the price will be at the "D" area then can a bullish bat pattern be affirmed and there is a good opportunity to buy. Set stop loss below "X", I recommend you to set stop loss below marked support and trendlines. There are 2 trendlines, I don't know which one is stronger but I suppose one of them is valid. Good luck, good hunt.
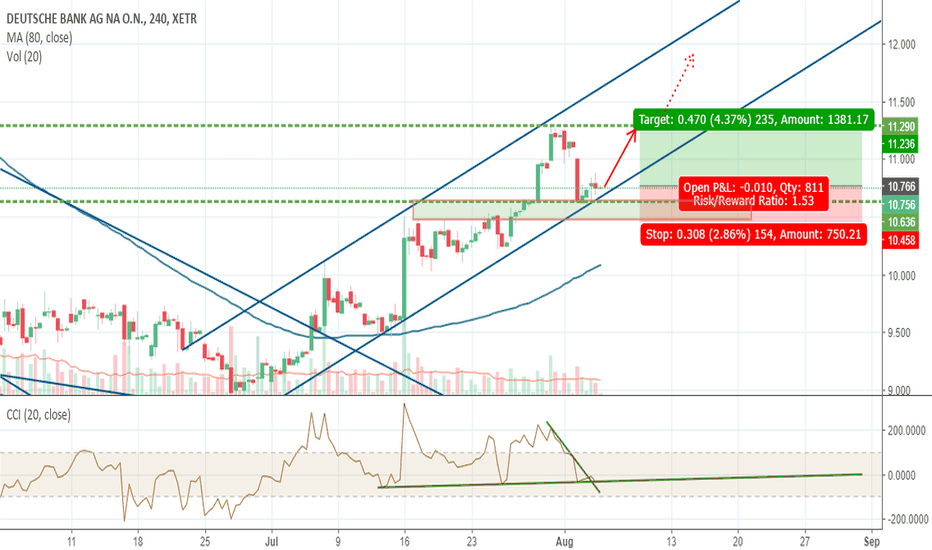
Detsche bank looks that the worst times are over. Bulls are getting stronger and downtrend can be possibly at the end. Actualy, the price is in bullish channel and the price is on the support. In my opinion this is good setup and tradable. CCI looks that is turning over.
We can find this bullish bat pattern on daily chart of GBPCAD. The pattern is not perfect but in my opinion, this is valid harmonic pattern.
We can se the price in channel and on the trendline, but the price can also fall on marked support. This is a good chance to make trade with good RRR. I made more scenarios of entry.
If the price will continue way down, it will be great opportunity to buy Ethereum. The question is if the price will react on the strong trendline or it breakdown the trendline and ETH will make a spin up in the support area. I would wait for that support and buy somewhere 390-400 USD.
This situation and this price really confirms my buy compulsion. The price should at least touch marked support area and the move up. But it's risky bcs of BTC. Bitcoin can pull all the market down or suck altcoins.
As we can see the price is in a triangle and on the resistnce. RSI show is overbought. This is a good short setup.
The sentiment of the price of BTC is clear. Everyone want to see the price up, on 9000-10000, and people are preparing for bullish ride. But technical analysis shows us that the price is not ready to move up. BTC is on important resistence and on the point where 2 trendlines are crossing. I expect another move down and then I will be full in BTC. Good luck and good hunt.
In my opinion this is good setup for short this fx pair. The price is on the resistence and also on the trendline of the channel. Good luck, good hunt.
Short setup, price is reaction on trendline. We can expect a way down.
The price is obviously on strong support and on the respected trendline. As you can see trend is with us. Good long setup
Digibyte is in the support area and is on the trend line, there is a good chance to move up. In the last 24 hours price fell by 8,84 % and it's bigger dump than others crypto. People withdrawed their profits from DGB, thanks to that the price is on the interesting level.


