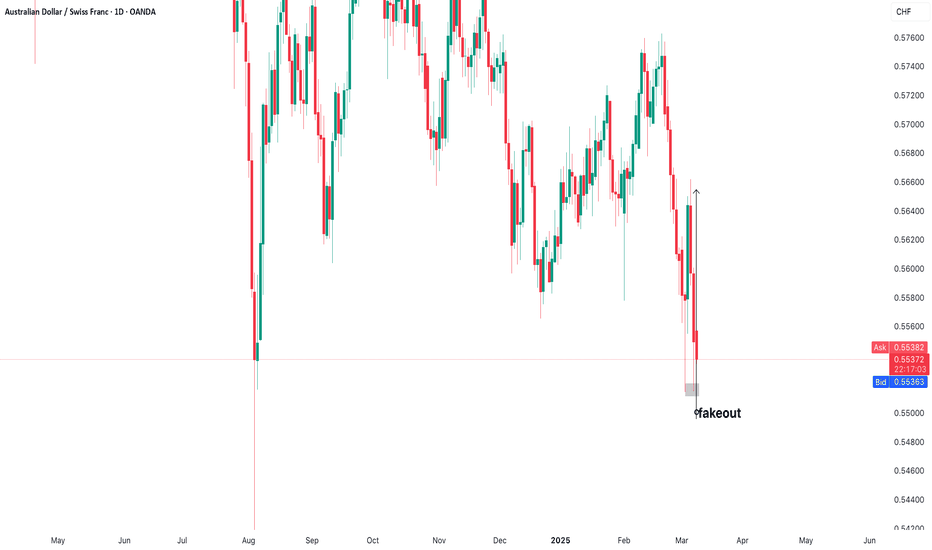
The full analysis is visible in the image; we are looking for a buy with targets at the FVG levels. If the dynamics change, we will publish an analysis for a sell.
We are looking to buy above the resistance level. The USD is weak and the price has not made a new lower low since December 18, 2024.
Based on higher time frames, we are prepared for buying rather than selling. At the support zone, be cautious of potential false breakouts. False breakouts almost always occur at important levels due to the placement of stop loss orders above or below the level. To avoid triggering stop losses, it is best to wait for a false breakout and then enter in the opposite...
The price is approaching a strong resistance level and the overbought zone. We need to be cautious of a potential false breakout, where many traders have their stop losses. Additionally, the pair has moved more than its daily average. This is a very interesting zone for selling, where we are definitely looking for sell opportunities rather than buys.
Considering the weakness in buying candles, we are seeking a short position during London open, executing the trade in alignment with the published analysis.
Let's monitor the EUR/JPY chart on the H4 time frame. This is a very simple but long-term highly effective analysis, followed by execution of positions and management. For buying, we look above the 162.500 zone, and for selling, below the same level. Targets are marked on the chart.
We are looking for buy continuation trade with confirmation at support zone.
GBP/JPY remains in an overall uptrend on higher timeframes. On the M15 chart, we are currently watching for buying opportunities after a breakout of key levels. Special attention is on a potential fakeout at the support zone, where, after a confirmation of the bounce, we could look for entries for long positions. Confirmation of the signal will be crucial to...
We are looking for sell entry because price is in down trend, sellers territory on smaller time frame but our target is at the H4 buy territory. We always scale from H4 to m15 or m5 to get better entry and tight stop loss but our target always stays the same. Do not get us wrong, overall we are bullish because price is in buy territory.
Hello Eurgbp is currentlz moving in range flow, but once it will confirm sell trend again you can start looking for sell on D1 and h4 timeframe. Price is holding position below overall channelling, but this is not clear confirmation for bearish move. Bearish move will be confirmed once price broke lower low of h4 timeframe and did a clear retracement. The second...
Hello guys In our published trade and analysis on NZDUSD we found a great opportunity to share with you. About every inch detail, our members have in vip conversation, but let's go through this trade anyway. NZDUSD pair is at the moment in overall sellers territory under sellers power pressure, because USD currency is at the moment very strong. On the other side...
Hello guys In this case we have a case scenario similar to our lessons we taught you. This kinda trades depends on patience. As you can see chfjpy is moving at the moment in neutral spot for longer time. There was a moment where chfjpy shoudl go bullish on 12.14.2021. Price didn't make it because of low momentum, so it stayed at neural spot between 123.435...
Hello guys USD is strong pair at the moment. All USD pairs are moving in correlation so we should take advanta of it as we already did with usdjpy in previous analysis. In this scenario sellers broke important lower low level, which was improtant for us to take advantage of it. We draw you a new support level at 0.67025 which presents safe entrance. If price can...
Hello guys In stih case usdjpy is at overall bullish trending on daily timeframe. Price in overall analysis cycle is moving at bullish territory, and is stuck between strong bearish momentum (last sellers push) and calm bullish momentum. Because sellers from last attempt didn't decide or push second time, we believe this might be just a break for them, because...
Do you think buyers have control, or sellers are still taking place at nzdchf? We are looking this trade as a strong sell Daily overall market sell NZD correlation trending sell H4 buyers failure D1 Lower Low failure Continuation trending idea Happy to share with you all Cheers
Hello everyone In this scenario price at NZDUSD currency pair haven't confirm any fact, but it's good to have NZDUSD in our minds. This pair might be good for trading later, we just need more data, more facts, before we hit a button for buy/sell. At the moment NZDUSD currency pair is in bearish trending and bearish territory. One interesting thing at this pair...
Hello guys Everyone who is Elite member - wait for proving decision if price will close that way GBPCHF currency pair is at overall bearish trending and bearish territory, which means price might hit higher levels or break H4 lower low level correctly. If price will continue higher, we have to take advantage from buy side on daily chart. Daily chart giving us a...
Hello In this case we are looking bearish trending adn confirmation flow on both daily and four hour timeframe. This analysis is presenting very strong and powerfull momentum flow, because both timeframes connect at once at the same timing. FLIPPING SIDE - Presents who has power on the market. At this moment we are count on bears. Daily confirmation - when...


