The current outlook for the Euro looks fairly negative if one considers where correlated assets are trading. As we represent in red boxes, which imply a negative input, no asset with a strong correlation to the pair justifies higher levels. What this implies further strength in the currency might be seen as selling opportunities. We've also drawn the ECB-led...
The risk-weighted index, mainly driven by a sharp decline in the EM MSCI index, further anchored by a fall in US 30-yr Treasury yields and strength in the Yen and Swiss Franc, is communicating that the outlook for risk appetite looks quite poor this Friday and heading into next week's trading. The hourly chart has broken below its 100-hourly ema, which has been an...
It's the first time this year that the US Dollar index is depreciating during a flattening of the curve, represented by a blue rectangle (yellow rectangles show the flattening of the curve not altering USD value), as recently reported by a Morgan Stanley paper. It implies a slowdown in US capital inflows, and the curve being a more accurate reflection of a...
A break higher in the risk index is set to reignite further weakness in the Japanese Yen crosses. The current formation of a narrowing triangle supports the 'risk on' environment heading into Thursday. It's also interesting to see how the 100-hourly MA has been acting as a reliable indicator guiding the risk rally. Keep an eye as a measurement to assess the...
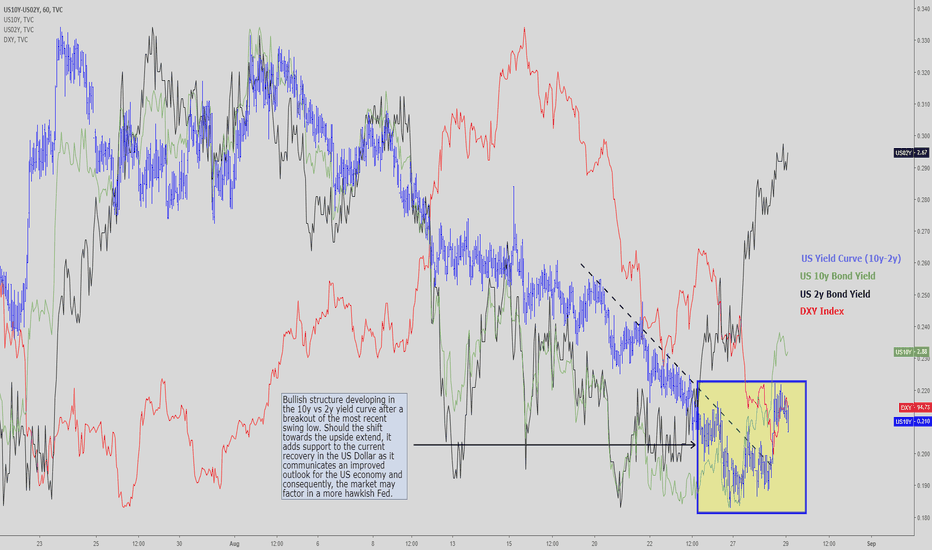
Bullish structure developing in the 10y vs 2y yield curve after a breakout of the most recent swing low. Should the shift towards the upside extend, it adds support to the current recovery in the US Dollar as it communicates an improved outlook for the US economy and consequently, the market may factor in a more hawkish Fed.
The 10y spread between Germany and the US is a stepping stone for further progress in the exchange rate, with a source of concern also Italy and German 2-yr yield spreads, exhibiting a major divergence with price action in EUR/USD. It's difficult to foresee a break of the macro resistance above amid the negative divergence in 3 out of the 4 most correlated assets...
Pay attention to the short/long-dated German vs US yield spreads, the risk environment, and the Italian vs German premium as the key drivers to gauge the next capital flows. For now, risk and the narrowing of the 10y spread rules price action, but a source of concern is Italy and 2-yr yield spreads, exhibiting a major divergence with the direction of EUR/USD. The...
Factors supporting a resumption of the AUD/USD trend: 1. The retracement in price shows divergence vs correlated assets 2. The latest leg up carried increasing tick volume. 3. So far, we are seeing a low volume correction. 4. We are in an intraday 2nd cycle out of potential 3 5. A resumption of the bullish trend targets 0.74/7410
EUR/USD is fast approaching a critical POC (Point of Control) area, which comprises the highest accumulation of volume through June-July, while a clear divergence continues to play in the risk-weighted index and short-dated yield spreads (2yr German vs US). Additionally, market participants must be reminded that the breakout of the range in early August was...
Divergences taking place between a cheap Yen and the deterioration in risk flows. While it may struggle to muster gains against a bullish USD, expect the Yen to regain ground, especially on the outcome of a breakout of the trendline. Monitor the breakout of the trendline closely. Note, the index encapsulates the most risk-sensitive asset classes, which when...
With regards to the constructive risk profile, pay attention here. It’s important not to be too complacent as the short term recovery in the risk-weighted index occurs within a wider negative context. From a top down analysis, we've drawn a few trendlines to represent the perils that entail for risky assets each time a violation occurs, which since the GFC, tends...


