Bullish momentum took priority came to 38.2 and pushed upwards also a strong hammer candlestick
Price has confluence on the fib levels and divergence on the RSI. looking at further downside movement
If price breaks-through support zone we can take a look at a downtrend starting to form
sometimes the 50 retarcement is used depending on where the swing high was taken form it could be viewed as a 618 or a 59. Nevertheless there was no retracement only a breakout of the triangle. so keep that in mind when looking at pennants and triangle patterns
Downtrend then triangle formation. Brea out of triangle then retrace to 38.2 on 1hr
We've had a significant push to the upside since March 2020. Price has currently created a triangle pattern. Suggest that a breakout may occur very shortly.
DXY seeming to be continuing to push towards the upside. Price hit a resistance level 103.05 and has retraces toe the 50 fib retracement. Looking at price to return back to 103.05. With potential to go further or price may use this region to hold further resistance to reverse to the downside.
Price has been on a clean uptrend since Feb 2020 with a pendant break and retouch. Since then Price hit 2016 resistance at 1.46. We currently have price creating a bullish flag which could suggest that price is heading to continue its bullish move. However plans can always change and sellers could persist and we could head back to 1.36. Im personally looking...
Previous daily head and shoulders turned into a second touch on the monthly 38.2 fib level. Looking closely at the daily support level around 1.222. looking for a break of this one to head to the first target at 1.20157 which was used last august and september 2019. With fundamentals looking steepish for the economy regarding Covid and a non moving economy we...
From looking at price action whilst also corresponding with the monthly time frames we can see that price has made a head and shoulders formation after the initial sell off. Which could indicate further downside movement. Correlation with hourly charts show 31.8 fib in use around 1.243. Let see this play out :)
With news surrounding COVID 19 and pressure for all of all the economy being in lockdown we can look at the chart formation to see how the market is reacting. On the monthly levels we have an evening start formation around 1.35000 Which could indicate a strong sell off from this zone. March candle continuing this probability with a hard push down to 1.165...
Price has been in a visitant downtrend since march 2018. Downtrend seeming to continue in 2020. price has respected 38,2 fib level constantly in larger and smaller time frames especially 4H. Looking for price to reach support level at approx 1.04791
Price has been on a strong bullish move since sept 2019. From a double bottom from previous support in September. Looks like a strong hold. Continuation pattern appeared shortly after. Price is currently in an area of a strong resistance. price is now likely to reverse to a Fibonacci level of 38.2
Price is overall on an incredibly bullish move. So overall opinion is a Buy. As price had made a series of new higher highs and lower highs on smaller time frames we may see price potentially have a correctional move a meet a retracement level however only time will tell. However I'm looking at price to touch around 2871 as that is price optimal zone that...
Clean and simple, price made a daily touch of the beautiful 61.8 resistance and now its on the move... its not that complicated Expecting to see a move towards the previous heavy resistance of 1.357
Price clearly has been bouncing off 1.77, a highly respected resistance zone. Not much to really write about, after 4/5 bounces of such a resistance line price is practically begging you to sell LOL.
After a little bit of consolidation we can finally see EUR/CAD getting on the move up. After a swift decline from previous resistance at 1.56 around December. We can see that price made a solid descending triangle; indicating that the bulls may have had enough. Bulls are now steadily but surely creeping back in the game. Im looking at further bullish movement for...
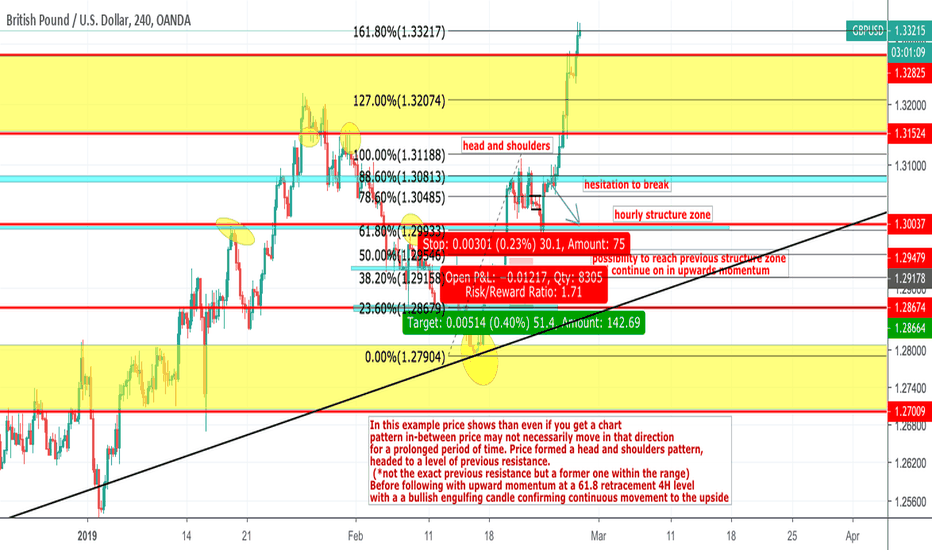
In this example price shows than even if you get a chart pattern in-between price may not necessarily move in that direction for a prolonged period of time. Price formed a head and shoulders pattern, headed to a level of previous resistance. (*not the exact previous resistance but a former one within the range) Before following with upward momentum at a 61.8...


