GoldMasterTrades
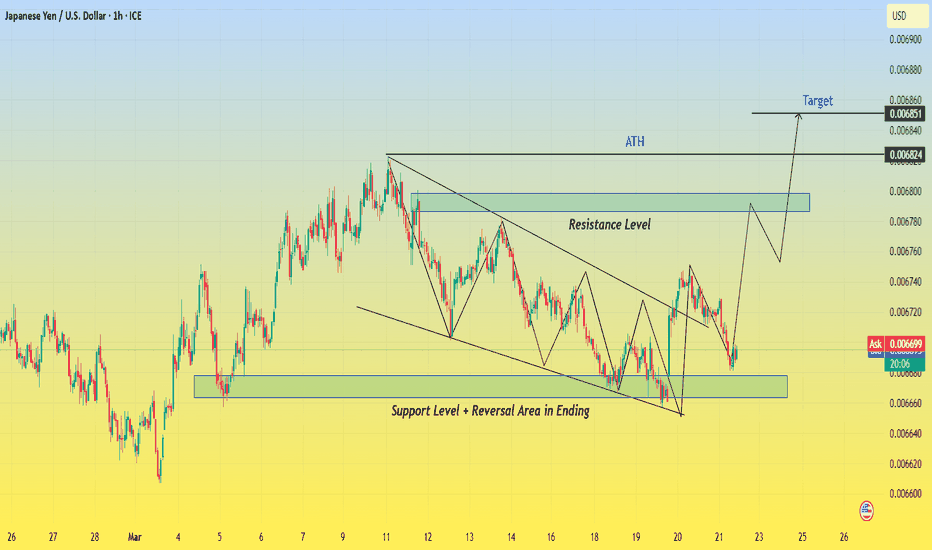
The JPY/USD 1-hour chart is displaying a well-defined falling wedge pattern, which is typically a bullish reversal setup. This pattern forms as price action moves within converging trendlines, indicating that selling pressure is gradually weakening. The breakout from this pattern signals a potential trend reversal, and the price may be heading toward key...
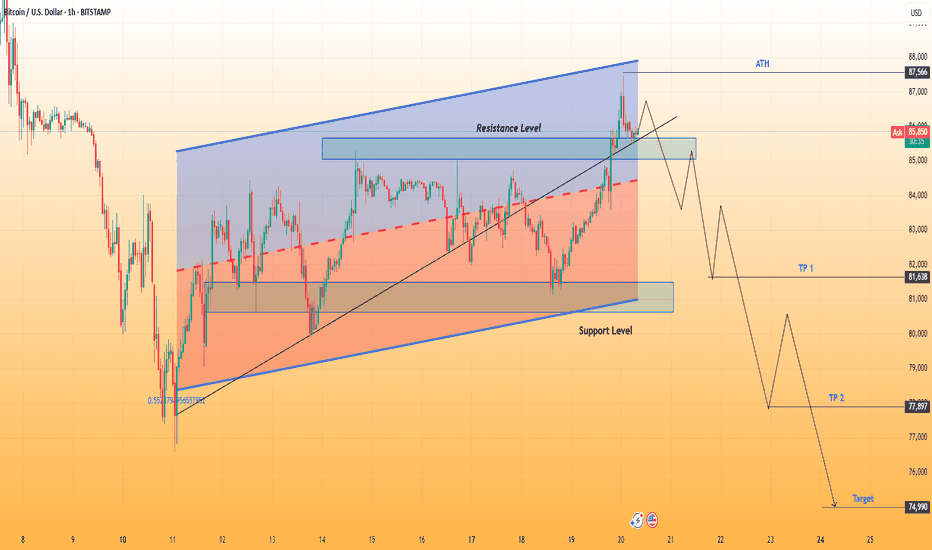
🔍 Market Overview & Technical Breakdown Bitcoin (BTC/USD) is currently forming a rising wedge pattern on the 4-hour timeframe, which is a bearish signal indicating a potential reversal. The price action shows higher highs and higher lows, but the narrowing wedge suggests that buying momentum is weakening. BTC has been battling a major resistance zone around...
Overview of the Chart & Market Context The 1-hour chart of Gold (XAU/USD) reveals a classic Head and Shoulders (H&S) pattern, a well-known bearish reversal formation. This pattern suggests that the recent uptrend has lost momentum, and a potential downside move could be in progress. Currently, the price is testing the neckline, which serves as a key support...
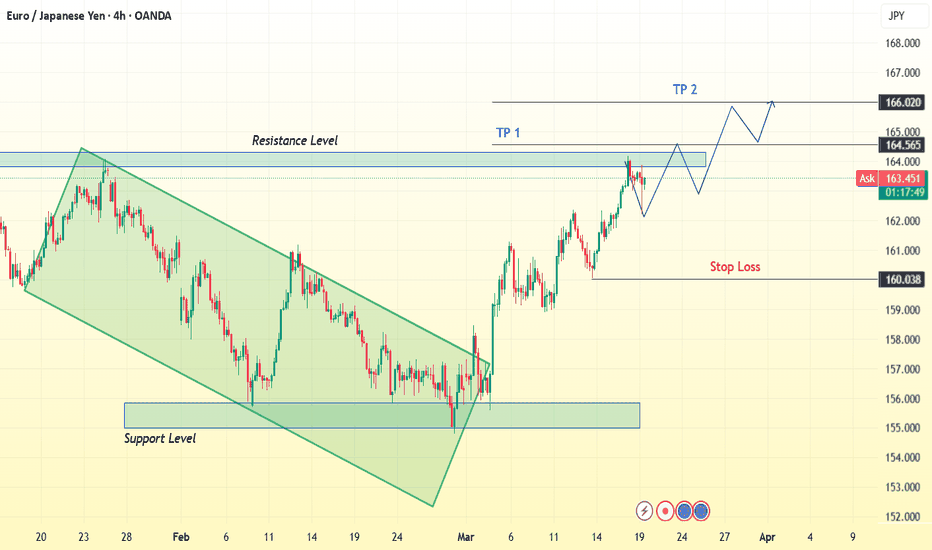
Chart Pattern Breakdown The chart presents a 4-hour timeframe for EUR/JPY, revealing a strong technical setup with multiple key patterns in play. The price action has been forming a falling wedge, a bullish reversal pattern, followed by a breakout. Falling Wedge Formation A falling wedge pattern is characterized by a narrowing range, where both highs and...
Chart Overview This EUR/GBP 1-hour chart highlights a symmetrical triangle pattern that has recently broken to the downside, signaling a potential bearish move. The chart includes key technical levels such as resistance, support, trendlines, and a projected price target. Let’s analyze each component in detail. 1. Formation of a Symmetrical Triangle A...
Chart Overview This is a 1-hour chart of Silver (XAG/USD) from OANDA, showing recent price action forming a rising wedge pattern followed by a bearish breakdown. The price initially rallied within the wedge but failed to sustain gains above the key resistance zone, leading to a strong rejection and downward momentum. Key Chart Elements & Analysis 1. Rising...
1. Market Structure & Trend The EUR/USD chart shows a previous uptrend, confirmed by the ascending trendline, where the price made higher highs and higher lows. However, the trendline has now been broken, signaling a potential shift in market direction. The price is currently retracing from a key resistance zone, and a possible bearish continuation is...
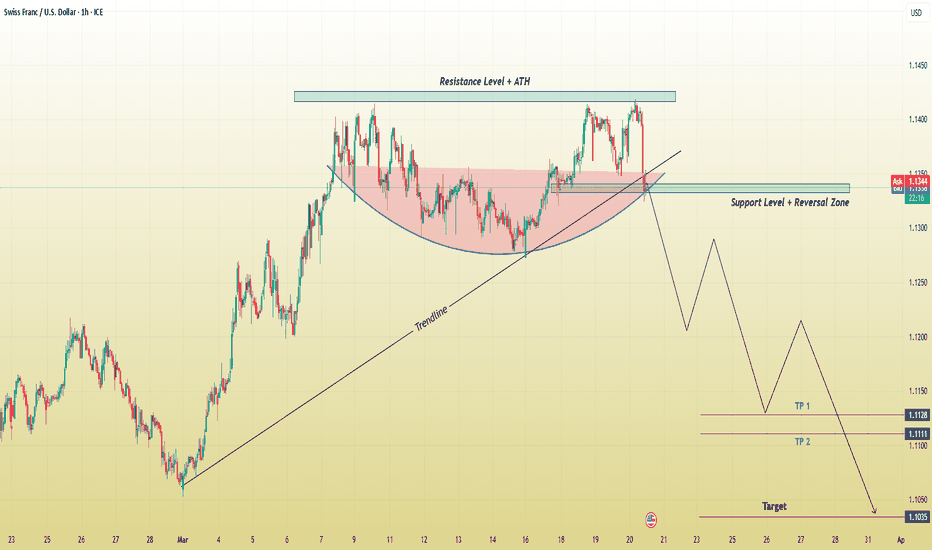
his CHF/USD (Swiss Franc/U.S. Dollar) 1-hour chart showcases a bearish trading setup, signaling a potential downside move after a failed breakout at a key resistance level. Below is a comprehensive breakdown of the chart, highlighting key technical elements, potential trade setups, and risk management considerations. 1. Identified Chart Pattern – Cup & Handle...
Overview of the Chart: The Japanese Yen (JPY) against the U.S. Dollar (USD) 1-hour chart showcases a well-defined market structure, transitioning from a downtrend within a falling channel to a breakout with bullish momentum. The chart highlights critical support and resistance levels, a confirmed breakout, and a forecasted price movement that could indicate...
Chart Overview: This chart represents Bitcoin (BTC/USD) on the 1-hour timeframe and showcases a Rising Wedge pattern. The price action has reached a key resistance level, and a potential breakdown scenario is unfolding. 1️⃣ Pattern Identification: Rising Wedge Formation A Rising Wedge is a bearish reversal pattern that forms when price moves within two...
📌 Chart Overview This is a 1-hour (H1) candlestick chart of XAU/USD (Gold to US Dollar), displaying a potential short (sell) trading setup. The price action suggests that gold is testing a strong resistance zone, and if it gets rejected, a bearish move could follow. The chart includes key technical elements like trendlines, support/resistance levels, and...
Technical Analysis & Market Outlook The Silver (XAG/USD) 1-hour chart presents a clear rising wedge formation, a well-recognized bearish reversal pattern. This formation develops when price action creates higher highs and higher lows within a contracting range, signaling a potential exhaustion of bullish momentum. Currently, Silver has broken below the lower...
The EUR/JPY 4-hour chart presents a compelling bullish breakout setup following a structured downtrend. The market recently broke through a significant resistance zone, indicating potential further upside movement. This analysis outlines key price levels, market structure, and an actionable trading plan. 📊 Market Structure Overview 🔸 Downtrend Reversal: The...
Market Context & Overview The EUR/GBP currency pair is currently showing signs of bearish momentum, as illustrated in this 1-hour trading chart. The price is facing a strong resistance zone while forming a descending trendline, indicating that sellers are gaining control over the market. Given this technical setup, traders can anticipate a potential breakdown...
The EUR/USD 1-hour chart presents a compelling bearish setup, characterized by a rejection from a key resistance zone, a weakening support level, and a potential trendline breakdown. These technical elements suggest an increased probability of downward movement if bearish momentum persists. Key Technical Components: Resistance Rejection & Selling...
This CHF/USD chart presents a compelling bearish setup, suggesting that the pair may be headed for a decline after facing strong resistance. The price action has followed a technical breakout and retest pattern, with a clear rejection from a well-defined resistance level. Traders looking for short-selling opportunities should take note of the key price zones,...
Let's take a deep dive into the JPY/USD price action and technical setup on the daily chart. The market has presented us with a falling wedge breakout, a strong bullish reversal signal. This pattern indicates a potential shift from the previous downtrend into an uptrend. 1️⃣ Falling Wedge Pattern – Bullish Reversal Signal The falling wedge is a classic bullish...
This chart represents a technical analysis of Bitcoin (BTC/USD) on the daily timeframe, highlighting key levels of resistance, support, and potential price movement. It indicates a bearish rejection from a supply zone, which suggests that BTC may experience further downside pressure. Key Components of the Chart: 📌 1. All-Time High (ATH) + Resistance Zone...


