Ethereum has completed a textbook breakout from a falling wedge pattern on the daily chart, signaling a bullish trend reversal. The breakout is supported by strong price momentum and a bullish Ichimoku Cloud flip. 🔹 Technical Analysis: ✅ Falling wedge breakout confirmed 🔼 Break above cloud resistance adds bullish confidence 📈 Targeting $2,800–$3,000, based...
Technical Overview: On the 1-hour chart, Gold is forming a clear bearish flag pattern, a continuation formation typically seen in downtrends. The flagpole represents strong bearish momentum, followed by a consolidation phase within a parallel channel – the flag itself. The price is currently near the upper boundary of this channel, suggesting a potential breakout...
Gold is trading below key resistance at 3,280 after a sharp drop, now forming a bearish flag around the 3,240 zone. Technicals suggest a potential continuation lower with a favorable risk-reward ratio. Sell entry activated at 3,240, targeting strong support near 3,200 (400+ pips) with a stop loss placed 150 pips above resistance. Fundamentals support bearish bias...
The USOIL H-2 Chart displays a classic Inverse Head and Shoulders pattern, signaling a potential bullish reversal. The neckline breakout confirms the pattern, suggesting upward momentum. A long position is considered with: Entry: Near current price around $62.31 Target (Take Profit): $65.53 based on the pattern's projected move Stop Loss: Placed below the...
A bullish Falling Wedge breakout has been confirmed on the 30-minute chart, with price breaking above resistance and entering the indicator . This suggests a potential trend reversal after recent downside pressure. 🔍 Technical Setup: Pattern: Falling Wedge (bullish breakout) Long Entry: 3323 (active) T arget: 3398 Stop Loss: Below 3285 Indicator : ...
Gold is showing signs of a potential short-term bearish reversal as a clear Head and Shoulders pattern has formed on the 30-minute chart. The price is testing the neckline near 3394, where a breakdown could trigger a move toward the 3330–3320 support zone. 🔍 Technical Analysis: Pattern: Classic Head and Shoulders, indicating a possible shift in market...
Technical Analysis: On the 4-hour chart, Gold has completed a bullish breakout from a Bearish Pennant formation, defying its typical continuation pattern to the downside. This breakout is supported by a strong bullish candlestick close above both the pennant's upper boundary and the Ichimoku Cloud, indicating a potential trend reversal and shift in momentum. ...
Gold has broken down from a clear bearish pennant on the 4H timeframe, signaling potential continuation of the recent correction from all-time highs. 🔸 Technical Outlook: 📉 Bearish Pennant confirmed with downside breakout 📉 Price breaks below Ichimoku Cloud support 🎯 Target zone near $3,035, based on pattern projection 🔻 Below key support at $3,287, bears...
Gold is forming a bearish pennant on the 4H chart, suggesting a potential continuation of the prior bearish leg. A confirmed break below the $3,275 support area may trigger further downside toward the key targets. Fundamentally, gold faces pressure from a firmer USD and rising real yields, which could accelerate selling momentum. Pattern: Bearish Pennant Sell...
The U.S. Dollar Index (DXY) has broken down from a well-defined bearish pennant pattern on the 4H chart, signaling continuation of the prevailing downtrend. 🔹 Technical Setup: Pattern: Bearish Pennant Breakdown Level: Below 99.00 Target: ~94.50 based on pennant pole projection Confirmation: Clear follow-through after breakdown, low volume consolidation 🔹...
Gold has broken out of a well-formed Bullish Pennant on the 2-hour chart, supported by strong momentum and a bullish Ichimoku cloud structure. The continuation pattern confirmed the trend following a steep bullish move, and price has now reached the projected target around $3,480. Fundamentally, gold remains supported by safe-haven demand amid geopolitical...
The Dow Jones Industrial Average (DJIA) has completed a breakdown from a rectangle consolidation pattern, signaling a potential bearish continuation. The index is currently trading around 41,790, with downside momentum increasing. Technical Analysis: Rectangle Pattern Breakout – Bearish continuation after range-bound movement Double Top Formation – ...
Gold is consolidating within a Triangle Pattern on the 30-minute timeframe, signaling potential volatility. A confirmed breakdown below the support level could trigger a strong bearish move toward the $2,990 target. Key Levels: Resistance: $3,110 - $3,147 Support: $3,098 - $3,055 Target: $2,994 Watch for a decisive breakout and volume confirmation before...
The US100 has been in a strong uptrend but recently formed a falling wedge pattern, a bullish reversal signal. After a period of correction, the price is testing a breakout from the wedge. If confirmed, the target aligns with previous highs near 22,000 - 23,000. A successful breakout could signal a continuation of the broader uptrend. 🔹 Key Levels: Support:...
Gold (XAUUSD) is showing signs of a potential bearish reversal on the 30-minute chart following a Rising Wedge breakdown and a Head and Shoulders pattern formation. Technical Analysis: Rising Wedge pattern suggests exhaustion in the uptrend. Head and Shoulders structure signals a shift in momentum towards the downside. Key Support Zone: $3,100 - $3,080 ...
Ethereum (ETH) has completed a Falling Wedge breakout followed by the formation of a potential Double Bottom pattern on the 4H timeframe, signaling a bullish reversal setup. Technical Analysis: Falling Wedge Breakout indicates trend reversal potential. Double Bottom structure formed around $1,700 – $1,750 support zone. Key Resistance Levels: $2,005 and...
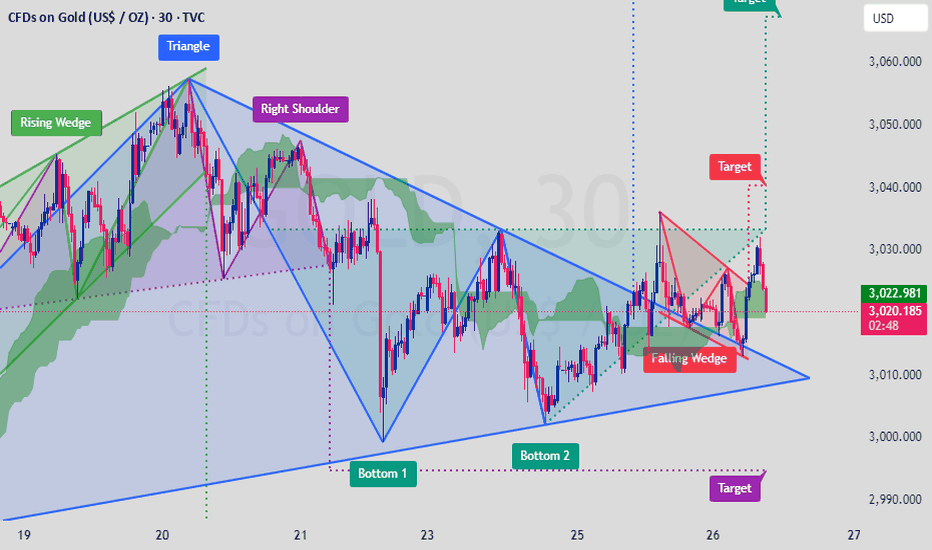
Gold is currently consolidating within a triangle pattern, attempting to break out after forming a falling wedge. The price is fluctuating near $3,022 , with key formations indicating potential volatility ahead. Technical Analysis: Triangle Formation – Price nearing a decisive move Falling Wedge Breakout – Temporary bullish push, but resistance holding ...
Gold is currently consolidating within a triangle pattern, attempting to break out after forming a falling wedge. The price is fluctuating near $3,022, with key formations indicating potential volatility ahead. Technical Analysis: Triangle Formation – Price nearing a decisive move Falling Wedge Breakout – Temporary bullish push, but resistance holding Support...


