It’s a good place to start seeing some up moves Time will tell for sure Maybe I’ll add some more detail later It’s been a long time since publishing anything
this is not a trading idea its only an update to my sessions bars script from a long time ago. I only changed the time values so it would work with Cryptos or at least the one im looking at. Anyone is welcome to them. I tried publishing them but i guess they are to old and have to be converted to a newer version and i dont know how. Hell a guy made the original...
i see the red zone as a good sell level for BTCUSD there are other reasons but ill just wait and see what happens
invite.robinhood.com for free stock so i sold all my free robinhood stock except for the one stock chk i took all that money and bought 10 november monthly $2 strike long calls those are whats called OTMs - Out of The Mony options I literally paid $30 bucks for the 10 contracts i immediately put in a sell to close on those same contracts for $100 "if" and...
share.robinhood.com ZNGA is also a robinhood freebee and also has been one of my better ones. How do i say this ... so i have seven total free share but four stock lol all of them free. Ive not put a penny into the account. Im hoping some of them breakout so i can sell them and buy something else maybe some GE leaps????
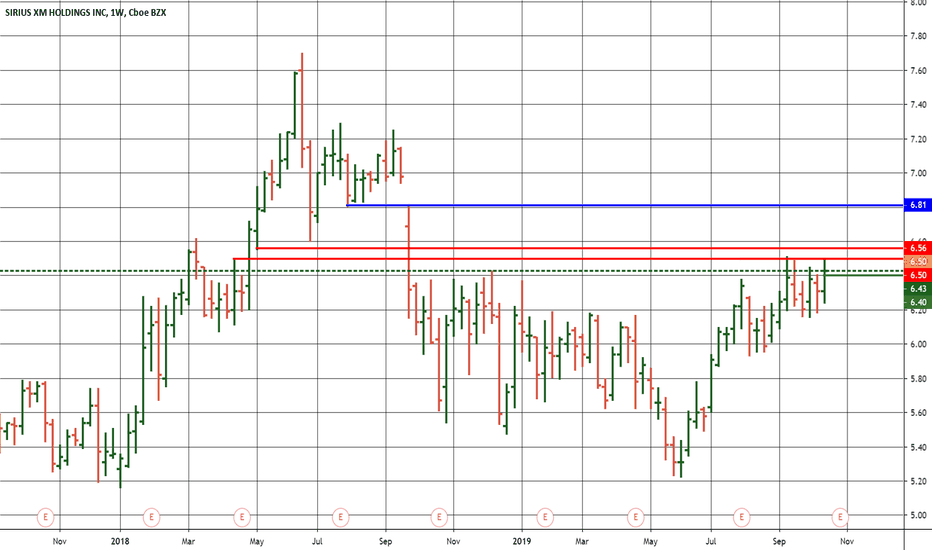
share.robinhood.com SIRI is my first free stock from robinhood and i have a whoppin 4 share and it has been my most profitable one. It looks like it wants to breakout of this sell level in the red and maybe make it up to the blue level...if it does its a gone ass cuz im sellin it
share.robinhood.com CHK is another freebee from robinhood its looking like a throw away so far but it is nat gas related and that seems to be a thing this week sooo who knows
share.robinhood.com Fit is one of my free stock from robinhood it appears to want to breakout
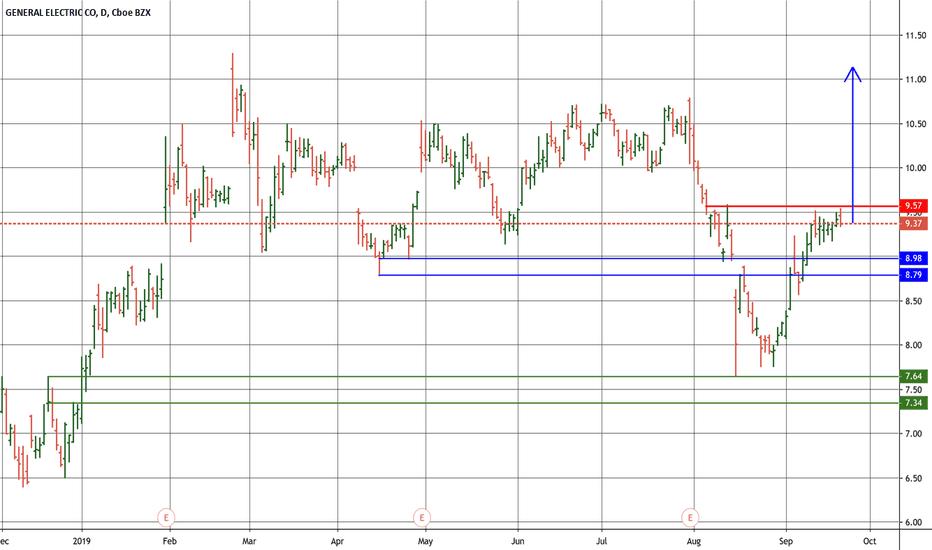
im just thinking GE might break out from this level and move up a good bit. As i thought about it i realize the equities are back up to high levels. So im thinking maybe GE and the broader markets will all breakout together. comments pro or con always welcome
the chart alone explains itself. Basically been in a down trend since middle of 2011. Was range bound from 2011 until April 2013. Has since been in another range. Last week i called out a couple small demand levels and price pretty much blew right threw them. Indicating to me that price still wants to go down further. There are some similarities to the ranges we...
This is a traditional RBR demand zone. On smaller TF's we can clearly see price has already reacted to it. This is I believe one of the 4 preferred S/D based patterns used by S/D traders. If I'm mistaken please let me know. Will this particular zone give traders enough lift to make a profit? Truthfully I don't know. No one can really know. But the thing is from a...
I'm not saying there is any correlation but the last three 8 year US presidential cycles have corresponded with record swing highs in the equities market followed by a precipitous drops.
gold has been on a steady decline for a long time now normally i do not put a lot of faith in zones way over to the left like this but there is a fresh uncrossed pivot high at this level in blue the first demand zone is in green dotted area the second is the one i have more confidence in simply because of the tiny little red candle represents a month of trading in...
see if this little one works its happening while im trying to post it
this is a large zone here and probably untradable as it is. It may can be broken down on smaller timeframes. My friends know what im doing here. This one seems a long shot but im just put it out there with an alert. Let it stew on its on.
Y'all seen me o this before but I'm put in an order for the upper level.
These two are sisters it seems, what applies to one likely goes with the other


