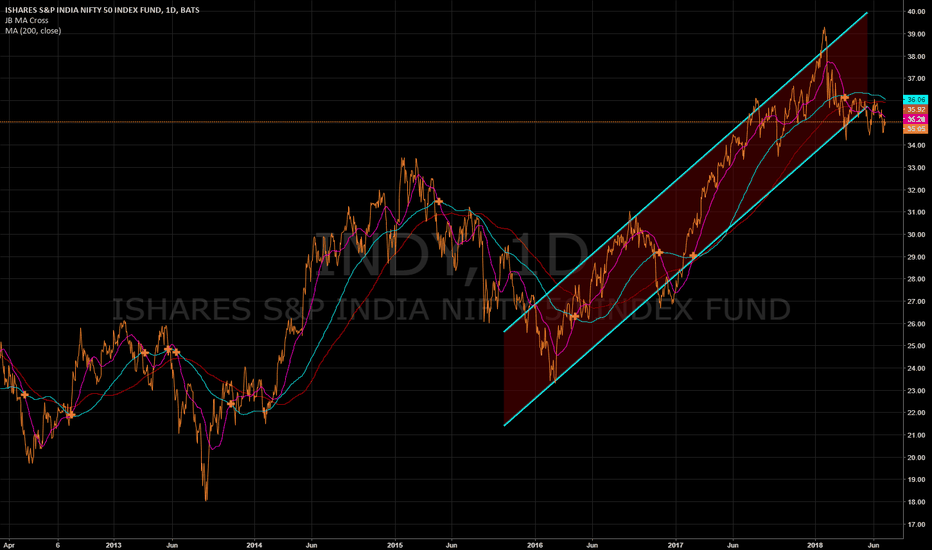
#3 so this is REALLY obvious for most of you. BUT, for newbies your time frame will mess with your indicators as well as your chart type hence the Renko previously posted.
Different perspective on oil price
I have never reviewed BTC but it looks bearish. Patterns looks like falling wedge. Below the cloud. MA cross to downside.
Bounce a big one but I don’t think the trend has changed yet
I think we still have more room to go down. HOWEVER, 42 should be looked at for a place to bounce a little in my opinion. Current position is a put calendar via $USO long February 9.5 and short April 9.5. If April puts are assigned before or at expiration I will then sell calls to create a covered call position.
I have no clue where this is going. BUT with interest rates going up as of this past Wednesday and 2 more for 2019 I could see it breaking the 72 level.
Not long no position. Waiting for bullish crossover
No position look for it to continue down
No position but it looks like support is holding.


