KiBeCh29
Could price be forming this complex H&S pattern? Also keeping in mind that price could be retesting the trend line after having broken it.. If so why not take a ride down IF price action gives a gud raison too!
After what felt like an eternity, price has finally formed the second shoulder completing what looks like an INVERTED DOUBLE HEAD and SHOULDER. Now price has reached the neckline and a major level of structure. One could ask themselves WHAT WOULD PRICE DO?.. break it right away? or take a short ride back down before trying one more time. With that shooting start...
With so many attempts to brake above that structure and the false breakout that happened yesterday and forming what is looking like a head and a shoulder, price is trying once again to break above it. IF it fails and gives us a gud raison to believe in a HEAD and SHOULDERS price pattern, then we will be going for short. #PatienceIsKey. Gud Luck
Gold looking very bearish with this descending trend line and the breakout below of the triangle. Now we looking at the first retest of the new resistance area. We will be going short if price gives us a gud price action confirmation
Price may or may not try to retest the 1.71500 level thus forming a Double Top pattern before dropping bellow the support. We'll be looking for a shorting opportunity if price DOES break the support past 1.70782 and goes back for a retest.
We previously thought that price was still looking bearish. However after this DOUBLE BOTTOM formation and BREAKOUT and what is looking like the retest of the neckline CAN WE STILL THINK SO?. Now if price respects the "retesting rules" we could see it push up towards 0.68711 and even further to 0.68785 thus forming what will look like a HEAD and SHOULDER and if...
The downtrend channel is still valid and price could still fall further down GUD Luck
Price has really been struggling to move further up and seemed to have reached another obstacle thus forming what possibly looking like a CUP and HANDLE pattern. However price fails to break that trend line, we could see a crash of price further down back towards 1.45500. Time and price action will tell. #PatienceIsKey GudLuck
WE have a TRIPLE BOTTOM and a break of the triangle. Price has been held hostage at the 1.46265 level with multiple attempts and the bulls haven't stopped trying to break that level.
Bearish FLAG? or break above and continuation. Price Action will tell. #PatienceIskKey Gud Luck
This is what we will be looking forward to for the starting of the new week if price fails AGAIN to break above the area around 1.71000 as it has before in the past. #PatienceIsKey
A DOUBLE TOP, a break of the neckline then a clear retest. We can expect a continuation of the down move if price action gives us a good raison.Look for entry raison on H4 and H1. #PatienceIsKey. Gud Luck
Shorting Opportunity if price pushes up in the red area towards 0.68060
We looking at a HEAD AND SHOULDER 1st, 2nd_a break of the Neckline for that pattern, 3rd_a retest of that level. if price fails to break above the red zone and gives us a good signal we will short it. #PatienceIsKey Gud Luck
The triangle has been broken, the trendline has been broken and we've got a W or DOUBLE BOTTOM formation. We can expect price to push up further towards 1.46600-900
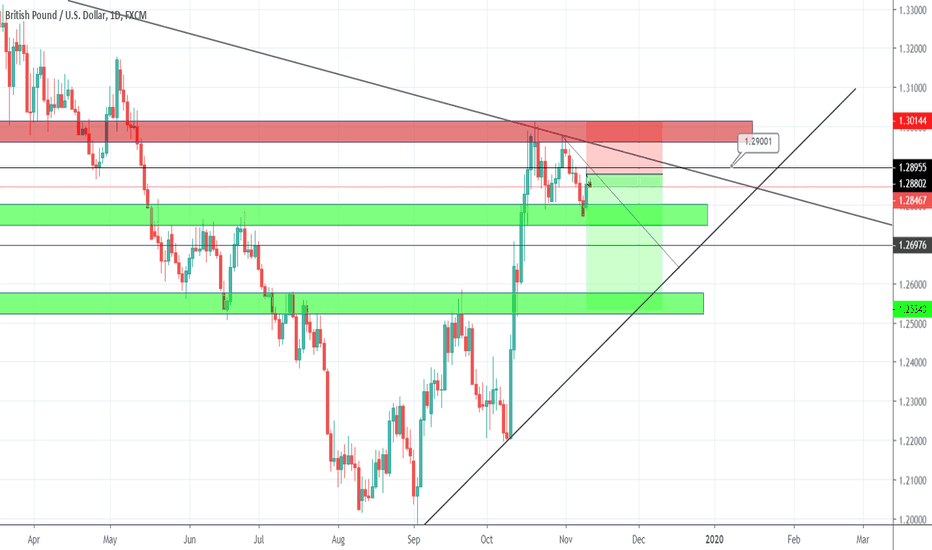
we could see a little retracement of price and a failure to brake above 1.29000 after the formation of the DOUBLE TOP. Knowing how price moves, it is very likely that it "may" or NOT try to retest that level again where it would be a gud place for a shorting opportunity. Nonetheless this pair is up for a long ride down until 1.25. #PatienceIsKey . Gud Luck


