BTC: Still Bullish but Lacking Momentum Bitcoin continues to exhibit indecision, with its price action failing to take a clear direction. Even the bullish movements it manages to achieve are notably weak and lack significant momentum. This ongoing uncertainty increases the likelihood of either scenario playing out, as BTC consolidates further without...
EURUSD: Short-Term Bearish Setup Today, the EURUSD saw an uptick due to news from Germany: "Germany's CDU, SPD have agreed on a solution with Greens on financial package." While this development is notable, it's important to remember that a single news item won't significantly strengthen the Eurozone. Sustained economic growth requires time and substantial...
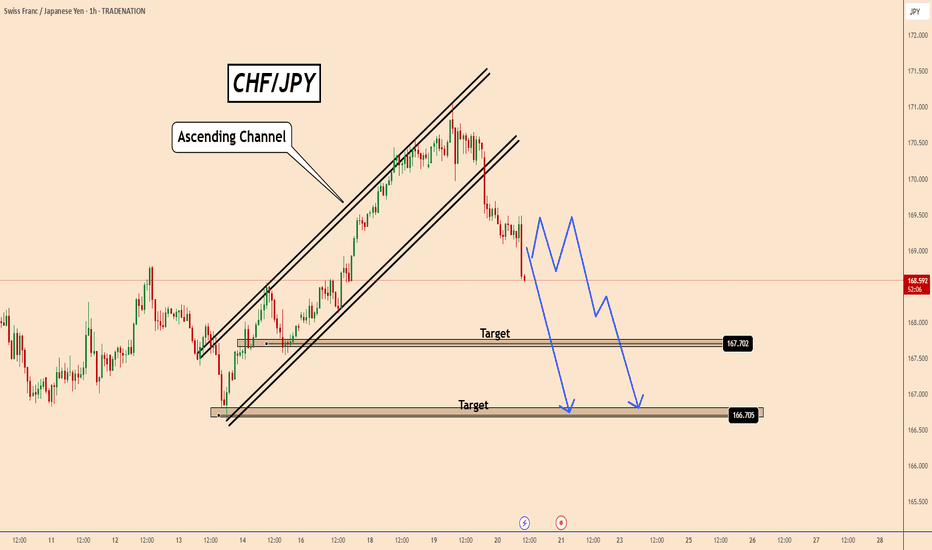
CHFJPY Bearish Momentum: Technical and Fundamental Insights" Technical Analysis: CHFJPY has entered a strong bearish phase following the breakout from an aggressive Ascending Channel Pattern. This breakout signals the potential for further price declines. After any minor corrections, CHFJPY is likely to continue its downward trajectory. Key target levels to...
CADCHF Bullish Outlook Ahead of SNB Rate Decision CAD/CHF recently completed a bullish harmonic pattern near 0.6055, and the initial price reaction has been promising so far. With the Swiss National Bank (SNB) expected to cut rates by another 25 basis points tomorrow—from 0.5% to 0.25%—this development may weigh on the CHF. While this rate cut might not...
XRP's Bullish Triangle: A Promising Pattern XRP has recently completed a bullish triangle pattern, which appears to be a strong and reliable formation. The growing trading volume further supports this bullish outlook. While Bitcoin's trajectory remains uncertain, many cryptocurrencies are showing signs of growth, potentially paving the way for Bitcoin to...
AUDCAD Eyeing 0.9300 On The Daily Chart Since late January 2025, AUDCAD has been steadily accumulating volume, leading to the clear formation of a bullish triangle pattern. Despite the Australian dollar's overall weakness, breaking through the critical resistance level at 0.9085 within this daily pattern has significantly increased the likelihood of further...
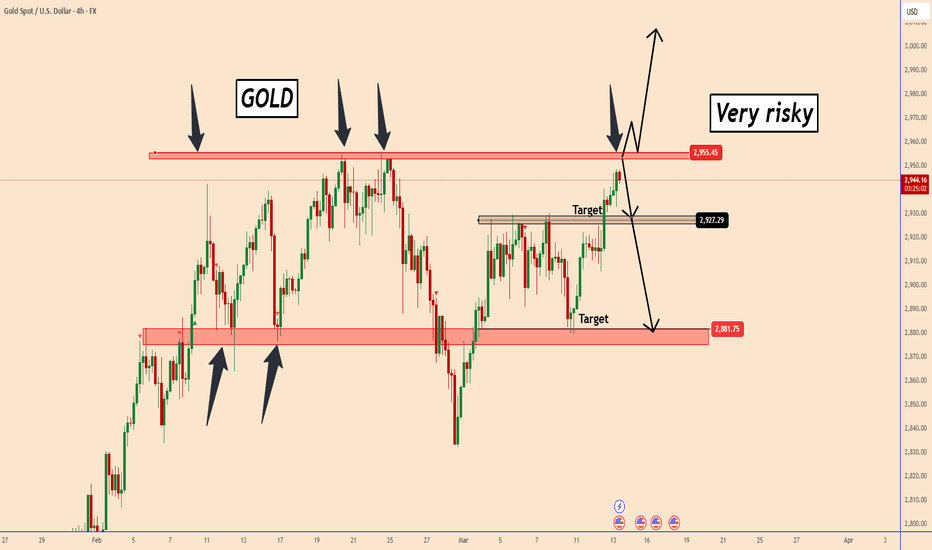
Gold Surpasses $3,000 Amid Escalating Global Tensions Recent developments in the Middle East have intensified, driving Gold prices beyond the pivotal $3,000 mark. The Israel-Hamas ceasefire has reportedly collapsed, prompting Israel to resume military operations in Gaza. In parallel, U.S. forces have sunk an Iranian ship amidst the ongoing Gaza...
BTC: Waiting For the Price Breakout - Both Scenarios Explained Bitcoin (BTC) currently shows potential for movement in either direction, yet remains in a state of indecision. At present, BTC is trading within a narrow range of 81,970 to 85,145—a 3.7% fluctuation observed over the past week. Bullish Scenario Should BTC break above the 85,145 level, it could...
GBPJPY: Both Moves Are Possible But It Has Higher Odds To Rise 19 March - Bank of Japan (BOJ) Rate Decision The BOJ is expected to maintain its interest rate at 0.5%, with no hike anticipated. While the rate decision itself seems predictable, the real market mover will likely be the press conference. If the BOJ avoids providing clear guidance on its monetary...
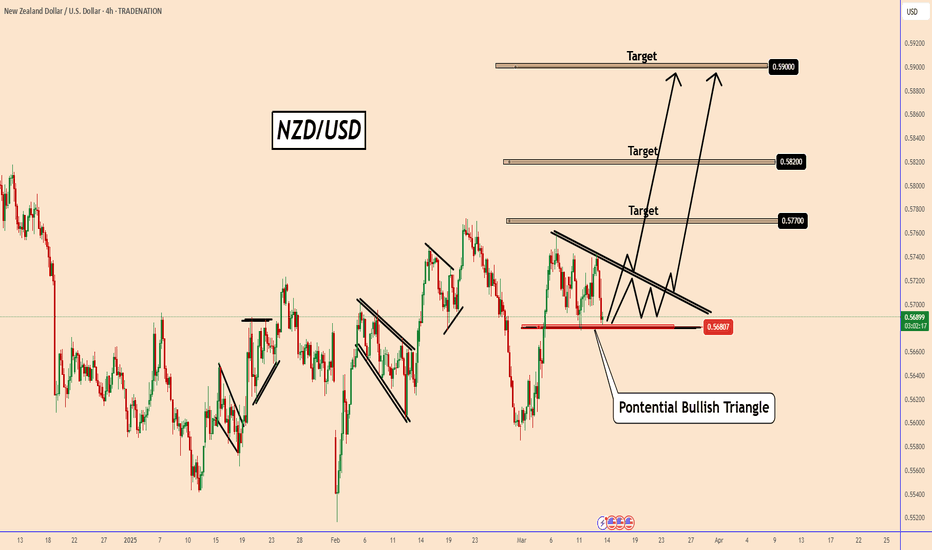
NZDUSD: In a Potential Bullish Triangle Pattern Examining the left side of the chart we can see that NZDUSD tends to accumulate before making its next move. Currently, NZDUSD is in another accumulation phase, and the current picture suggests a "Potential Bullish Triangle" pattern. If the price holds above the support zone near 0.5680, the likelihood increases...
DOGE - Bullish Breakout: Key Levels to Watch DOGE has confirmed another bullish pattern, bouncing back after several unsuccessful setups. The current pattern appears both clear and solid, with a promising price breakout already in motion. If the price successfully climbs above the 0.1780 level, the likelihood of a swift bullish movement will significantly...
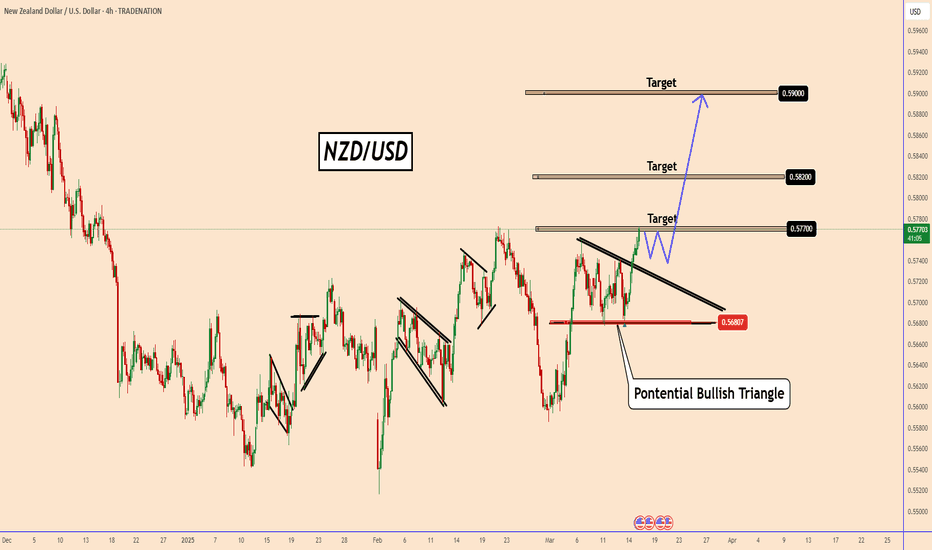
NZDUSD Gains Momentum Amid FOMC Uncertainty From our previous analysis, NZD/USD has raised by approximately 120 pips. Currently, the price is trading above the triangle pattern, signaling potential further growth ahead of this week’s FOMC meeting. The FOMC is anticipated to maintain interest rates at 4.5%. However, the Federal Reserve's lack of clarity...
LTC at a Double Resistance Zone LTC faced a double resistance zone on the 4-hour timeframe, located near 112.80. The price has already moved down, and on the 60-minute chart, a small bearish pattern has emerged, indicating a potential further decline. It appears that LTC may begin a bearish trend from this zone. Key support areas: 95, 88, and 80.50 You may...
GOLD: Geopolitical and Economic Turbulence During the last three weeks, there have been significant developments in the geopolitical and economic arenas. But what exactly happened? Geopolitical and Economic Developments: Trump's Tariff Threats: President Trump continues to threaten with tariffs, increasing market uncertainty. His recent comments have even...
EURJPY: A Large Corrective Pattern in Development The EURJPY currency pair recently encountered a significant resistance zone from above. Historically, the price has repeatedly declined after testing this dynamic zone, increasing the likelihood of another bearish movement. Adding to the downward pressure is the Bank of Japan's (BOJ) influence. The BOJ's recent...
Natural Gas: Potential Depreciation Towards 3.2 Natural gas has recently broken out from a strong support zone, which has now turned into resistance. The price may develop around this area before moving down again, especially given the previously strong bullish trend. A robust support level is expected near other structural zones at 3.8, 3.6, and 3.2. It is...
GOLD: In-Depth Analysis Today, I present to you an in-depth analysis of GOLD. In this analysis, I delve into the factors influencing GOLD's price movements, examining both the potential reasons for upward and downward trends, as well as various trading scenarios. You May Watch The Analysis For Further Details! Thank you:)
ETH Price Volatility: Beware of Trump's Comments From our previous analysis, the price reached the first target. After Trump posted new comments, ETH surged by nearly 17%, tested the structure zone, and then moved down again at a time when everyone was expecting it to rise further. However, it appears he may be playing with the markets, and hedge funds are...


