Lorenzo_Esco_Al_Bar
It seems like the most popular criptocurrency is likely to form an Inverted Head and Shoulders pattern, which is one of the most reliable price pattern if you want a long entry. The real test will be at 11730.
USoil in an uptrend channel moving towards the 64$ price level in the next weeks. 50 period EMA supports the trend. No divergence on RSI.
It appears that EUR/GBP is changin it's direction since it hit the 0.88 area. The RSI shows that the strenght of the trend is becoming bullish, the 50 period moving average is crossed and it's now functioning as a support for the price. Grafically it appears that an uptrend channel is likely to take place.
USD/CAD on a clear uptrend is now testing the 1.27 resistence level. Now it might slow down, moving in a range or retracing but If the price passes that 1.27 resistance it would be a bull until the next important test at 1.29
Currency pair EUR/AUD is very likely to continue its range between 1.58 and 1.56, where also the 100 period EMA function as a support. RSI follows price chart, showing no particular divergence or sell-off signal. The lower shadow on the support, instead, reveals that bears are particularly weak in that area.
The DAX is recovering from last week's lows. The hammer confirms that the 12000 level is a strong support. The trend line shows that a shy uptrend is taking place. It will probably retrace on the 50% fibonacci level where also the 50 and 100 period EMA will function as a resistence.
Possible buy on the 50% fibonacci price level, in which the 200 period moving average works as a support
Dollar rises after today's CPI data. A solid head and shoulders pattern on XAU/USD is revealing itself. The 1314.26 price brakeout will be the sell off signal, with a possible target around the 1300 area, where Fibonacci and the 100 period exponential moving average support the price.
If the formation is completed it would be a bear movement towards the 1.20 levels.
It appears that EUR/USD pair is forming a head and shoulders inverse pattern on the dalily chart. The pattern is not complete yet so taking action right now is very risky (and maybe very profitable, as always). In case we see a long movement in the next days, it would definitely be a buy for the Euro. Let's wait for tomorrow's NFP...
Market is testing the 1.33 resistance. Bulls apper to be the strongest. Candelsticks show us a Harami and a hammer that might be the confirmation for the long. The breakout above 1.33 is the entry signal.
Bitcon set to continue its bull-run. Candlestick analysis on hourly chart shows bear's weakness with long lower shadows. Triangle pattern is formed, while volumes are still low. The breakout of the triangle's upper line will be the signal. If you are a more aggressive trader you can get in the market when the price bounces on the lower trendline.
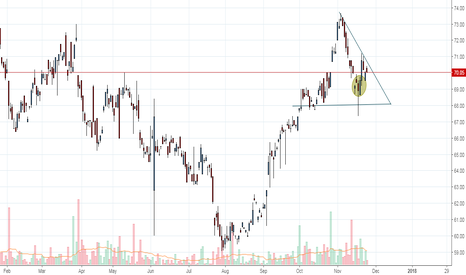
Idea on German stock Volkswagen. Low volatility is forming a triangle pattern on the hourly chart. The brakeout of one of the two trendline will be the signal for the move.
Today EUR/GBP found a resistance at 8.95, important price level signaled by Fibonacci Rentracements. In the longer run though the trend seems to be bullish: the brakeout of the upper-line of the triangle pattern that has formed will be the confirmation.
Pretty nice opportunity on german equity market. Daimler's dalily chart shows growing bull's volume, a hammer and a triangle pattern. All togheter these three elements indicate that a bull trend is soon coming, even for the long term.
Possible triangle pattern on Gold daily chart. USD recent weakness seems to be pushing up gold. Bollinger bands and MACD also might confirm that a movement is going to be happening soon. Brakeout of 1296 price level should be the confirmation for a new up-trend.
It appears that a solid bull trend is forming on GBP/USD, ending the trending renge between the 1.33 and the 1.30 area started in October. The brakeout of the 1.33 area will be the signal for the buy. Then the next two resistance will be at 1.346 and 1.362.
It appears that a solid bull trend is forming on GBP/USD, ending the trending renge between the 1.33 and the 1.30 area started in October. The brakeout of the 1.33 area will be the signal for the buy. Then the next two resistance will be at 1.346 and 1.362.


