Magic_Wike
I would like to buy a house and not overpay 50-100%, so time to die housing market. Been looking for 1.5 years and I'm over it ya'll. Fell below bullmarket support band for the first time since May '20. Rounding top, bearish candles in recent price action. Probably gonna take another leg up, but hey a guy can dream can't he?
ETH looking very bullish. Fell out of ascending channel into symmetrical triangle, indicating continuation of uptrend. RSI looks healthy, MACD looking like its about to cross into the green. Currently riding the 50MA and trying to break out of triangle. Want to see continued high volume, there are also some signs of overextension, but currently are outweighed by...
golden cross a few days ago, breakout of werdge, rsi div
There are some indications on the USD chart as well, but here SUSHI just hit an important historic support/resistance level vs BTC. If this holds as support, could be a good sign of bottom. SUSHI has underperformed other alts and other doxes, while still being one of the top 3 in terms of volume.
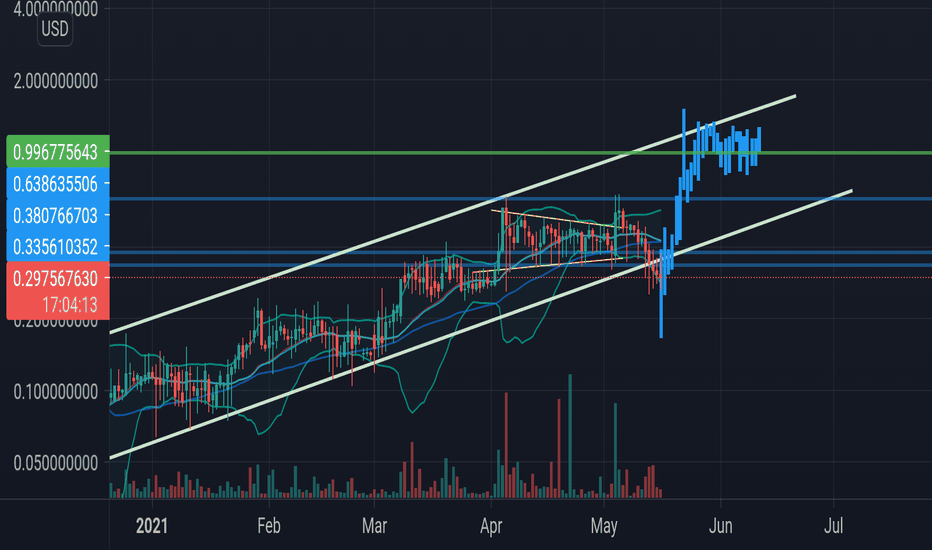
Golden Cross just formed on RSR daily chart. Promising, but chart is showing me mixed signals. RSI is healthy, volume on a slight downtrend/sideways, etc...also broke down out of ascending channel...could end up being a trigger for upward movement if volume increases and broader ALT market goes on a run, but could also be a sign of further bearish...
Idk if it will happen now, but expecting a ~30-50% correction at some point in the near future before taking another move higher. RSI divergence and OBV show top signals, bearish engulfing candle. Time for a breather I think FYI, the bars pattern is the May correction -- not saying we are taking a huge dip tomorrow, but expect sideways movement at least and some...
Sorry for mobile chart, quick one here...doge trying to break out of long triangle. SAR shows buy, 9/20 emas about to cross indicating potential buy. RSI looks healthy. More dog coin pump age?
immediate edit: looking at this for 2 more seconds, you could definitely argue that we are breaking out of triangle as we speak...thats what I get for being too busy to look at charts this week... -Honestly, no idea what to make of the current situation -- crypto market looking very shaky and more corrections would not surprise me one bit -That said, setting...
-symmetrical triangle forming over the past few weeks, indicates continuation of uptrend -golden cross -RSIs in buy territory -about to print hammer candle after testing lower trendline support -targeting 45%, size of triangle
Spare me your tears I don't like it either, but the charts don't lie. ADA has been an absolute unit so no I don't think it's done, but I think it needs more cooling off before we test ATH again. -rising wedge pattern that looks awfully similar to the one earlier in Sept -9/20 EMAs about to cross into sell zone, stoch RSI same -Currently tesing upper range of bol bands
The coinbase pump is often short lived, and this has only corrected ~15% from the local high. teetering on the upper end of bb and stochi RSI. Targeting ~.00000745, but could go lower -- or could moon who the hell knows, DYOR =)
Bonus points if anyone can tell me what the Trump/Right wing conspiracy about silver...seriously my father tells me to buy it and says he has his sources which is usually some crazy conspiracy nonsense. Door 😅
Will the longer term crypto market bull cycle end before ETH even tests it's ATH against BTC in the 2017 bull run?
I don't like it either, but BTC is looking bearish. Symmetrical wedge/triangle forming on the daily indicating a continuation downward. Based on previous moves, another dump down to 20k would make sense, followed up a minor relief to around 22-25k for new support. I might be encouraged by the BTC rally if not for the fact that alts continue to rebound faster...
As long as the market recovery continues..read that twice BEPRO tried to reverse against BTC per my last post on it (linked), it broke out but then BTC dumped and took the rest of the market with it. Recovery for everything is encouraging so far, as long as this trend continues, I except BEPRO to get back up in the .015 -.2 (USD) range before too long DYOR
Just an idea...bars pattern is from Mar 2020 after covid flash crash..publishing this just so i can watch it
I am actually a proponent of the "expanding cycles" theory and I expect that this bull market / the market in general will move more slowly than in 2017 or past bull markets -- so I do not expect this chart to hold up exactly. What I do expect is that before we see a true reversal towards end of alt season / end of bull market, we will see BTC.D drop *below* 2017...


