A potentiol breakdown below the support level could indicate a bearish move . a clean break below the wedge structure could a short position. price falling to sustain above a certain level .
1. Uptrend Channel: A blue ascending channel marks a previous bullish movement. 2. Higher Demand Resistance Zone: A rectangular box at the top highlights a resistance level where price previously reversed. 3. Price Respect Area: A green circle marks a point where the price interacted with the resistance before declining. 4. Downtrend Projection: A potential...
The chart displays a volatile price movement, with multiple swings between support and resistance. A triangle pattern is highlighted, suggesting a breakout occurred. 2. Support & Resistance Zones: Support Zone: Marked at the bottom, where price has bounced multiple times. Resistance Zone: Marked at the top, indicating previous rejection levels. 3. Trade...
1. Trend Analysis: The price has been moving in an upward channel with two support lines drawn. The price recently broke below one of these support lines, indicating potential weakness. 2. Trade Setup: A short (sell) position is suggested in the red zone. The projected downward move is marked with a red arrow. The target price for the downward move is...
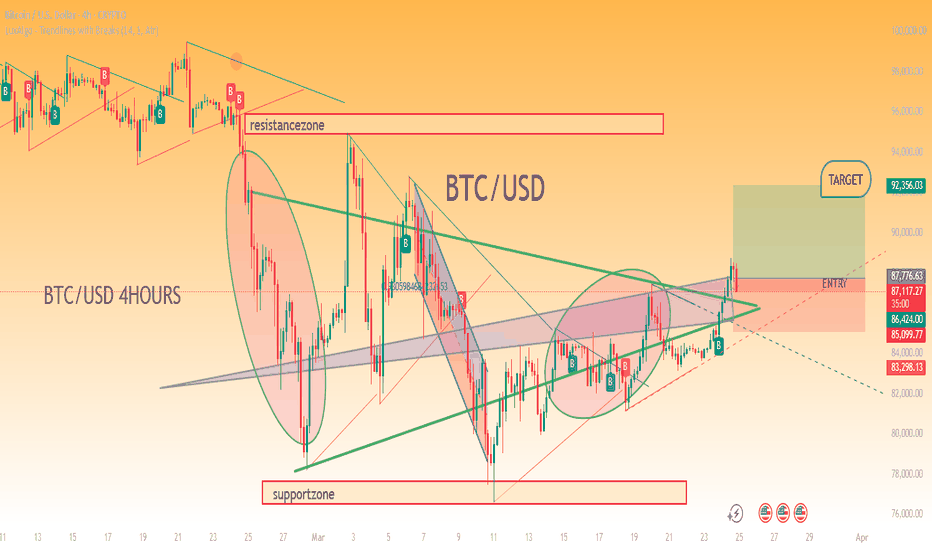
Several trendlines and triangles are drwan,indicating price consolidation and potential breakout points. some eliptical shapes highlights previous action movement. An entry point is on or marked near the breakout area. A target price around 92156 is shown in the green zone,suggesting a bullsh outlook. The current BTC price on the chart is 87,322.09. the top right...
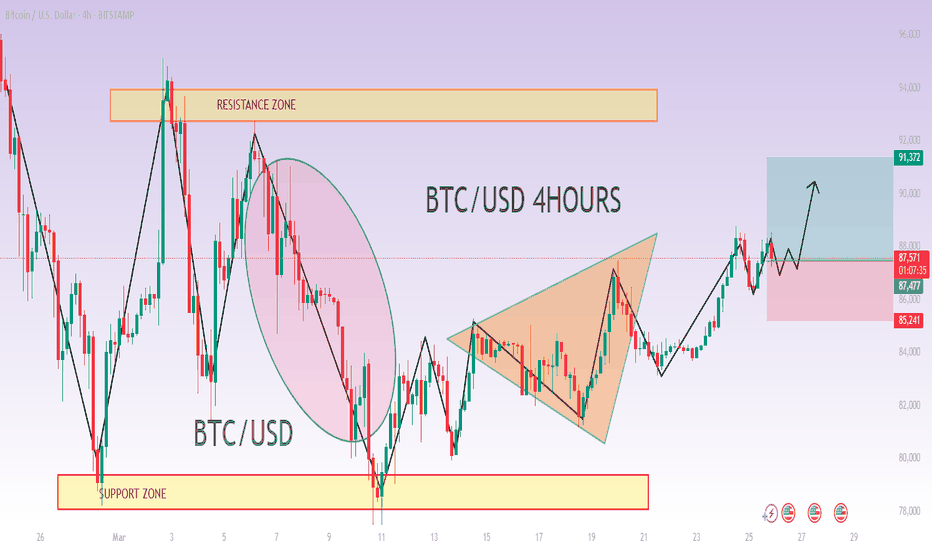
A resistance level is marked at the upper section, showing where the price has faced selling pressure. A support level is indicated at the lower section, highlighting where price has previously bounced back. 2. Chart Patterns and Price Movements The left side shows an uptrend channel with price making higher highs. A curved pattern in the middle suggests a...
A large upward price movement (bullish trend) followed by a decline. Support and Resistance Zones: A support zone is marked at the lower levels where the price previously bounced. A resistance zone is marked at the upper level where price struggled to break through. Sell Signal & Price Prediction: A red "Sell" label near a declining price trend, suggesting a...
A support identified below,where price has previously found buying interest. A potential bearish move downtrend,with an expeceted pullback before further decline . A rectangular zone highlights the possible consolidation before a downward move.
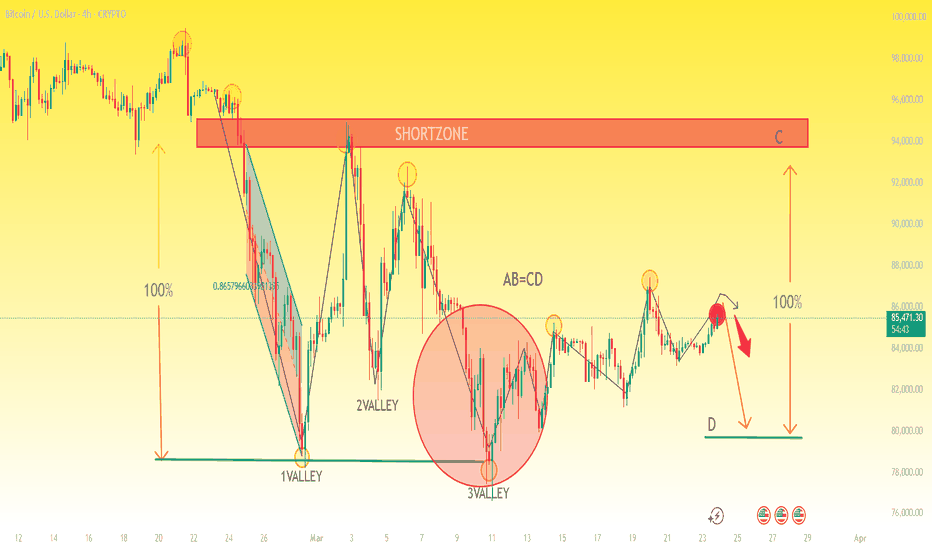
There are labels like “1VALLEY,” “2VALLEY,” etc., indicating major swing lows or troughs in price. The chart highlights large price swings from a high down to a low, then back up, and so on. Harmonic Pattern (AB=CD) The letters A, B, C, D are marked, suggesting an AB=CD pattern, a common harmonic trading setup. Harmonic patterns often project that if price...
1. Trend & Market Structure: The chart shows an uptrend followed by a potential reversal. The price has reached a resistance zone, marked at a higher level, where it is struggling to break above. A support zone is marked at a lower level, indicating a possible target if the price moves downward. 2. Trade Setup & Analysis: The chart suggests a bearish move...
the resistance zone is marked at a higher level, showing where bitcoin price has struggled to break through. A support zone is also highlighted at a lower level,where the price has found stability. the setup suggests an expectation of either a bounce from support or a breakout from resistance. As far as I think, the market should go down from here because it has...
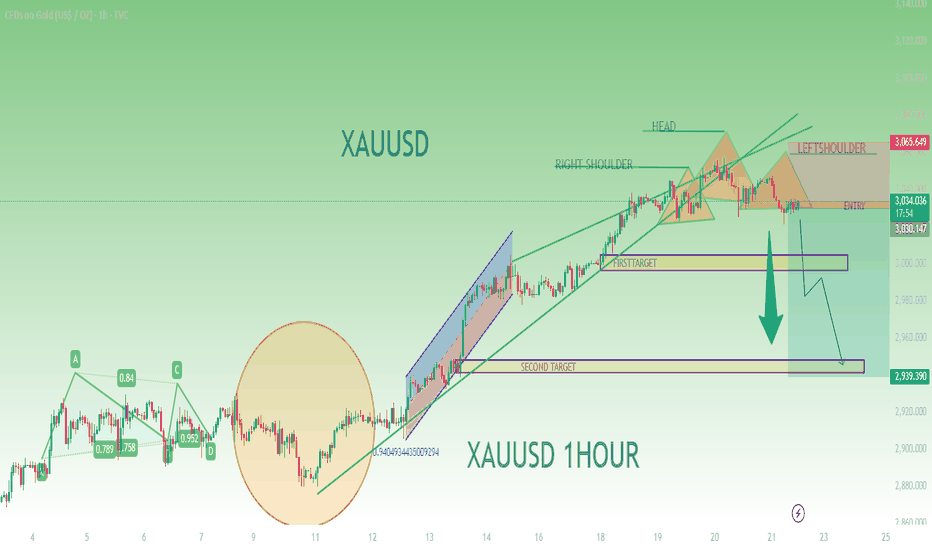
the previous trend was bullish high in blue with an upward channel. after forming the head and shoulder,a bearish move is exected,as shown is downwards arrows. price is projected to break below the nickline and hit the lower target zone
Taking a short position on Gold as it tests the resistance level . Expecting a potential pullback Gold prices have been under pressure due to a strong US dollar and rising interest rates. The recent rally has created a selling opportunity, with the potential for a pullback
1. Downtrend & Market Structure: The chart displays a strong bearish trend with a downward channel (red and blue zones), indicating previous selling pressure. The price has broken out from this bearish structure, showing signs of recovery. 2. Harmonic Pattern Formation: A harmonic pattern (possibly Gartley or Butterfly) is drawn with labeled points X, A, B,...
Support Held Strong – The price has tested the support zone multiple times (around $82,000), showing signs of buying pressure. Reversal Pattern – The higher low (LH) formation suggests that sellers are weakening, and buyers are gaining control. Projected Bullish Move – The chart outlines a breakout scenario with an upward trajectory. The target zone is around...
1. Price Movement & Trend The chart shows Ethereum's price action in a downward channel (blue and red zones), indicating a bearish trend. Recently, the price broke out of this channel and is attempting a recovery. 2. Support and Resistance Zones Resistance Zone (Upper Box): Marked near the 2,990.31 level, indicating a potential area where price could face...
📈 GOLD BUY 🔹 Entry: 3033 🔹 Stop Loss: 3023 🔹 Take Profit: 3133 ✅ Strong Support Zone – Gold is holding above a key support level. ✅ Bullish Momentum – Market trend indicates potential upside. ✅ Safe Risk-Reward Ratio – SL is tight, and TP offers a good profit margin. ✅ Global Uncertainty – Economic factors favor gold as a safe-haven asset. Looking to go long on...
1. Support & Resistance Zones: Resistance Zone: Marked at the top where price is expected to struggle to break higher. Support Zone: Marked at the bottom where price has historically bounced back up. 2. Market Structure: The chart displays higher highs (HH) and higher lows (HL), indicating an uptrend. A bearish pattern is forming at the resistance zone,...


