Bearish Engulfing + Wedge+ Bearish Divergence indicating a deep drop with NKE we just need breaking down the upper trend on weekly chart for the confirmation, it would be nice to hold an option put position
Double bottom with strong volume , it would be good to return back near to 7.5-8 to buy again toward 20 again
ETH Is moving inside a channel after breaking the triangle, as soon as 1240 will hold in daily we will see a resumed uptrend to 161% of the last correction
ETH Is moving inside a channel and triangle, it seems we will have a deep drop with ETH/USDT in case we see a break down below 1182 with a daily close below this level for the next support level 919, so be cautious as it's supported by strong Divergence on MACD
Bearish Divergence with Weak Candles seen, fundamentally nothing will push stocks up Since the monetary stimulus package that expected approval has been already priced in the market, and we are expecting a temporary rebound before next drop that would happen until 15 Feb
Reverse Head and Shoulder BTC to 39000 again we need also to break the high for further up move
We have an ascending Triangle with high volume breaking up we will see a gap or uptrend next week toward 16-17
As long as BTC under 11720 resistance BTC will target the median pitchfork seen now @ 6975 , If price breakup the Resistance we will see 22000 which is not possible according to the bearish pasterns seen
ICOs demand leading Lend to 0.00034 , confirmed by ABDC pattern+ MA + low selling volume mean buyers still control the market
ICOs Demmand leading Lend to 1.000034 soon , that was supported technically with ABCD pattern supported by golden MA and low selling volume indicating that we would see the target soon
Fth Impulse eliot wave and CD Harmonic wave leading us to 1840 soon , support 767 should hold to reach this target with 2-3 months
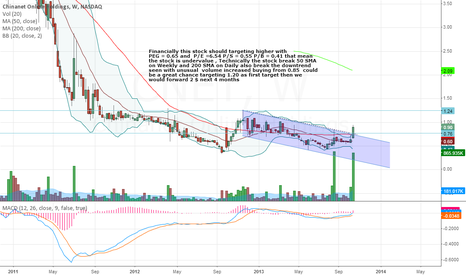
Financially this stock should targeting higher with PEG = 0.65 and P/E =6.54 P/S = 0.55 P/B = 0.41 that mean the stock is undervalue , Technically the stock break 50 SMA on Weekly and 200 SMA on Daily also break the downtrend seen with unusual volume increased buying from 0.85 could be a great chance targeting 1.20 as first target then we would forward 2 $...
ETHUSD ABCD pattern , the pattern would be confirming D wave by breaking above 380 with target 576 after that
Seems like Bitcoin would target 6218 Wave 5 target then the correction pattern would be seen
GARTLEY PATTERN SEEMS IT WILL GO UP TOWARD 320 , SELLING FROM THEIR WOULD BE ASWOME !
Ebay with retesting 30.50 should goes up again if support hold in daily chart
Update for


