📉 Correction & Location Insight All-Time High: ₹5,039 Current Low: ₹2,424 ✅ Correction from Top: ~51% ✅ Price has now entered a Monthly Point of Interest (POI) after taking liquidity and showing reaction. This level is crucial as the price has dropped significantly and is now tapping into a major institutional demand zone, signaling a potential bottom...
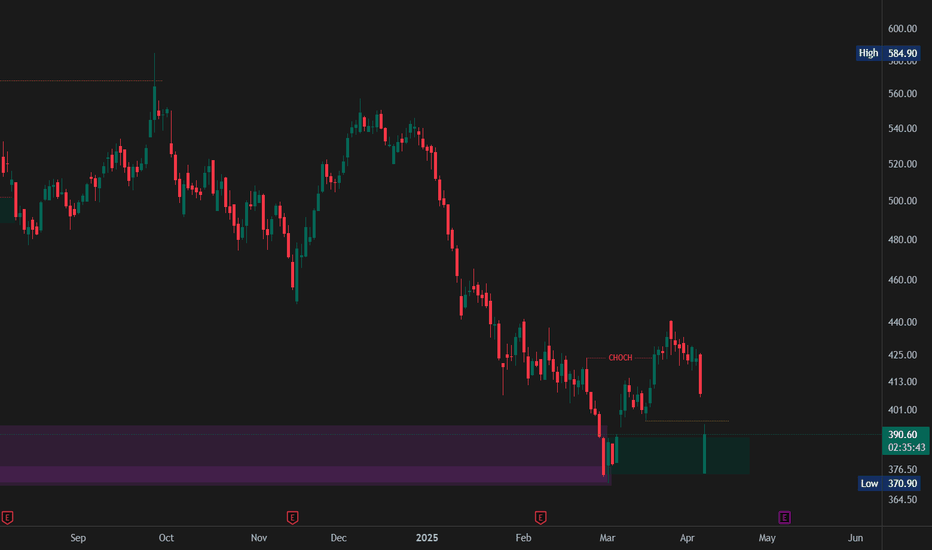
🚨 APOLLO TYRES – Technical Analysis & Trade Plan 🔍 Swing / Positional Opportunity 🔎 Step-by-Step Analysis 1. Monthly Timeframe View 🔸 Previous Monthly High: ₹584.90 🔸 Apollo Tyres Corrected 36.7% from ATH 🔸 Current Market Structure: Price has now entered a strong Monthly POI (Point of Interest) zone. 🔸 Today’s Low: ₹375 – This aligns exactly with our...
Description: ✅ Deepak Nitrite is currently at a critical accumulation zone, making this a great time for long-term investors! 📊 Key Market Structure: All-Time High: ₹3,469 (Aug 2024) Recent Low: ₹1,790 (Down ~45% from ATH) Current Price: ₹1,983 Monthly Swing Low Taken (2021 Levels) Consolidation Phase (Oct 2021 – April 2025) indicates a potential big move...
Description: 🔎 Market Overview & Technical Structure Hindustan Unilever (HUL) is showing a strong technical setup for both short-term (BTST) and long-term investment opportunities. After a prolonged 2-year consolidation phase, the stock has finally broken out of its previous high from September 2021, indicating the potential for a strong upward move. 📉 Stock...
🔎 Market Overview & Technical Structure Nestlé India has undergone a significant 25% correction from its all-time high, presenting a strategic investment opportunity. The stock has recently swiped a key monthly swing low and is now showing signs of potential upside movement. 📉 Stock Correction from High: All-Time High: ₹2,789 Previous Monthly Swing Low:...
Description: ✅ SWSOLAR is showing strong bullish potential after a deep correction of 73% from its recent high of ₹824 (May 2024). The stock is currently trading at ₹255, and based on my analysis, momentum is shifting towards an upward move. 📌 Key Observations: Historical Price Action: Listed in August 2019, with an all-time high of ₹753 before the COVID low of...
Step-by-Step Analysis 1. Monthly Timeframe Analysis 📌 Previous Monthly Swing High: ₹1,650 (Liquidity Taken) 📌 Current Market High: ₹1,802 📌 Key Swing Low: ₹1,060.55 📌 Accumulation Zone: ₹943 – ₹846 ✅ The price has now reached this accumulation range, making it a potential long-term buying opportunity. 2. Daily Timeframe Confirmation ✅ The daily chart shows a...
Nifty Analysis & Trade Plan – Trend Shift & Key Levels 📌 Market Structure & Trend Analysis Daily Time Frame: The trend has shifted to a downtrend after a Change of Character (ChoCh) below 23,875. Weekly Time Frame: The POI has been tapped, aligning with the daily trend shift. Monthly Time Frame: The price has broken below an Internal Daily Market Structure...
HAL Investment Opportunity: Breakout from Consolidation – What’s Next? Market Overview: HAL has recently tapped a key weekly Point of Interest (POI) at ₹3,080 – ₹2,323 and rebounded strongly, confirming institutional buying at lower levels. 📌 All-Time High: ₹5,674 📌 Weekly POI Support Zone: ₹3,080 – ₹2,323 📌 Recent Price Action: After consolidating between ₹3,430...
IDFC First Bank: Swing Trade Setup – Key Levels & Entry Strategy Market Overview: IDFC First Bank has recently pulled back after making an all-time high and is now testing a critical support zone on the monthly timeframe. This presents a potential swing trade opportunity, provided we see confirmation at key levels. Today's low is ₹52.60, and a break below ₹52.15...
Market Overview: SRF has finally broken out after a prolonged consolidation phase that lasted from September 2021 to March 2025. This long period of sideways movement indicates a time correction, where price remained within a defined range (₹2,865 - ₹2,002) instead of a sharp decline. Step-by-Step Analysis 1. Breakout Confirmation & Market Structure 📌 Previous...
Analysis of HDFC Bank Weekly Chart Resistance Zone Observation: Historically, HDFC Bank has encountered resistance multiple times around the price zone of ₹1,724 - ₹1,788. The chart highlights several occasions where the price approached these levels and retraced, showing this as a significant resistance area. Current Breakout Attempt: As of the latest data,...


