10 Year Yield Prints Inverted Head and Shoulders? This could carry significant repercussions - economic, financial
What is MOVE Index trying to tell us about TLT in the immediate future?
Ascending Broadening Wedge naturally bearish but failure of pattern also important. Price target 1.618 golden fibo off the entire move?
Yield Curve correlation with DJI. Feb-Mar 2023 drawdown?
Inverted graph. Golden ratio active on hood? What should shorts look for?
50 WMA tag. Bull flag. Channel breakout. Consolidation. Pivot. Transportation to nirvana imminent?
I think the RAIL is laid in the right track. If the cup and handle works...
Multi decade channel with iron resistance level seems to have broken. Retest underway for months.What will happen next?
Bull pennant. RSI breakout. MACD line bounce, recalibrating up.
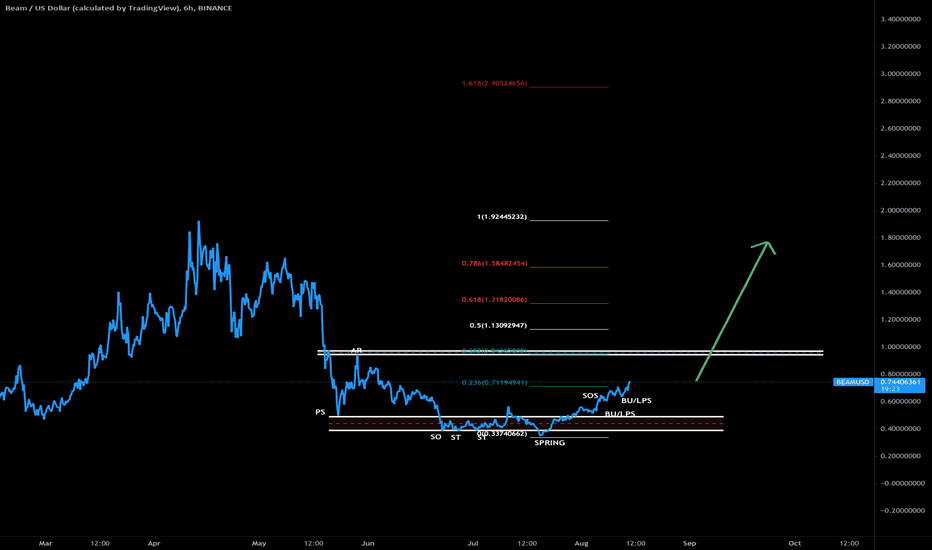
Super future technology BEAM in Wyckoff again? Golden ratio target? Escape velocity.
Possible Wyckoff range complete. last BU/LPS. Golden Ratio in cross hair
What will the box do? Bottom in Longs previously revealed a crash. Daily RSI is even worse now.
Red line was powerful support in February. 0.382fib reverse fib of the entire bull run just underneath in green. A wick down to the green and a close above the red might signal a 'broadening bottom reversal' chart pattern with possible profit target or possible short positioning in red box area.
BTC target met on this pattern. What next? Next 24 hours will tell.
Overheated oscillators? Tough megaphone pattern. Descent into reload zone before final phase blow up.


