WEEKLY: Tagged weekly fair value gap, could continue moving higher DAILY & 4h: Still showing bullish order flow on daily and 4h. Potential internal to external range move
Daily: Inversion fair value gap was violated. Potential bearish shift 4h: Showing bearish order flow, price bouncing off of a bearish fair value gap.
Weekly on potential external to internal move Daily chart showing bullish order flow and potential internal to external move.
Daily chart showing bullish order flow. 4h showing bullish divergence and inversion fair value gap 1h showing potential internal to external range move
Weekly showing price taking low and closing above it, leaving a rejection candle Daily showing a potential internal to external range move
Weekly showing potential external to internal move (retrace) 4h bouncing off of Daily inversion fair value gap and 4h fair value gap
Daily chart showing bearishness 4h chart showing potential internal to external range move. Lower time frame manipulation with SMT. Entry above midnight open
Weekly chart is showing price at discount but still in bearish order flow Daily in bearish order flow and showing a potential internal to external range move
Daily chart showing bearishness 4h chart showing potential internal range to external range move. 1h chart showing liquidity purge, SMT with AU, entry above midnight open
Daily chart showing bearishness. 4h chart showing potential internal range to external range move. Fair value gap is in premium 1h showing SMT divergence and entry above opening price
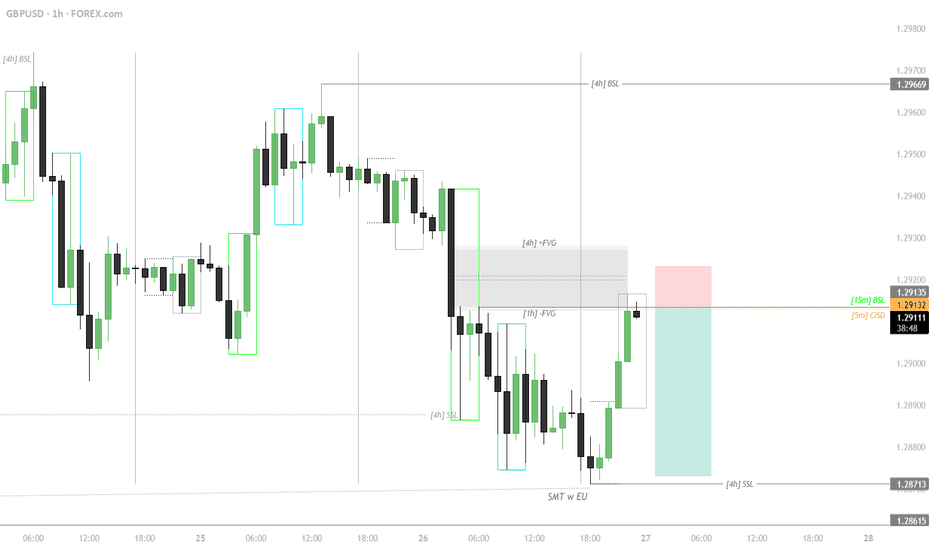
Daily chart and 4h chart are showing bearish order flow 4h and 1h chart are showing potential internal range into external range move. Fair value gaps on both 4h and 1h are being respected. SMT divergence on 1h and 15m.
Daily and 4h time frame showing bearish order flow. Potential internal range to external range move on both 4h and 1h time frame. SMT divergence w EU
Weekly chart hit a HTF liquidity and showed a change of state in delivery on daily chart. 4h chart showing bullish institutional order flow
Order flow on daily and 4h is bullish. 1h showed consolidation then manipulation / liquidity purge with SMT
Daily & 4h: potential internal range into external range move Liquidity purge within 4h fair value gap and SMT with EU
Weekly candle showing strong bearish candle. Potential OHLC Daily order flow is bearish. Potential internal range to external range move 4h similar to daily, order flow is bearish. Potential internal range to external range move
Daily showing strong bullish candle 4h's order flow is bullish and potential internal range to external range move 1h: liquidity purge, entry below opening, SMT w NU
Daily showing strong bullish candle 1h showing liquidity purge and SMT with EU Entry below opening price


