PouyanFa
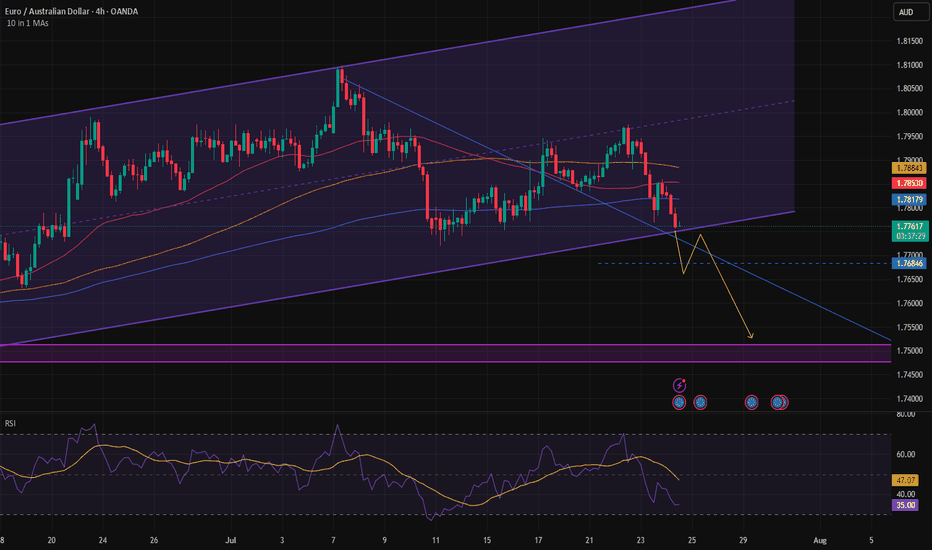
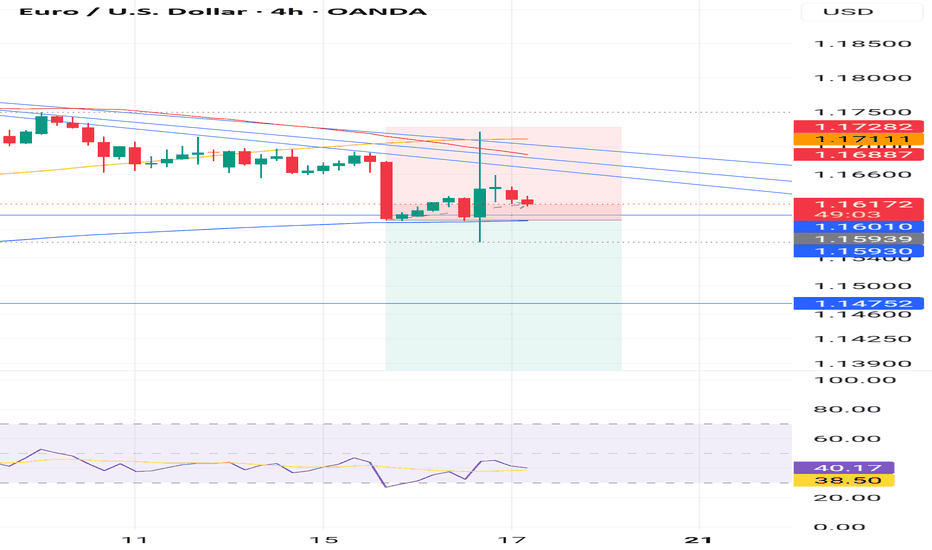
EssentialIf the channel breaks downward with a standard and confirmed candle, it could be a good position to take down to the 1.75000 level.
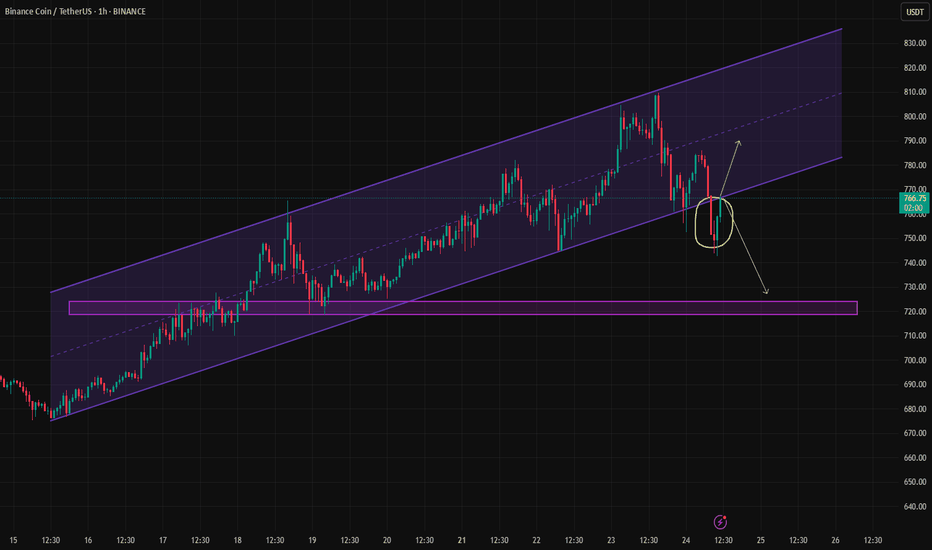
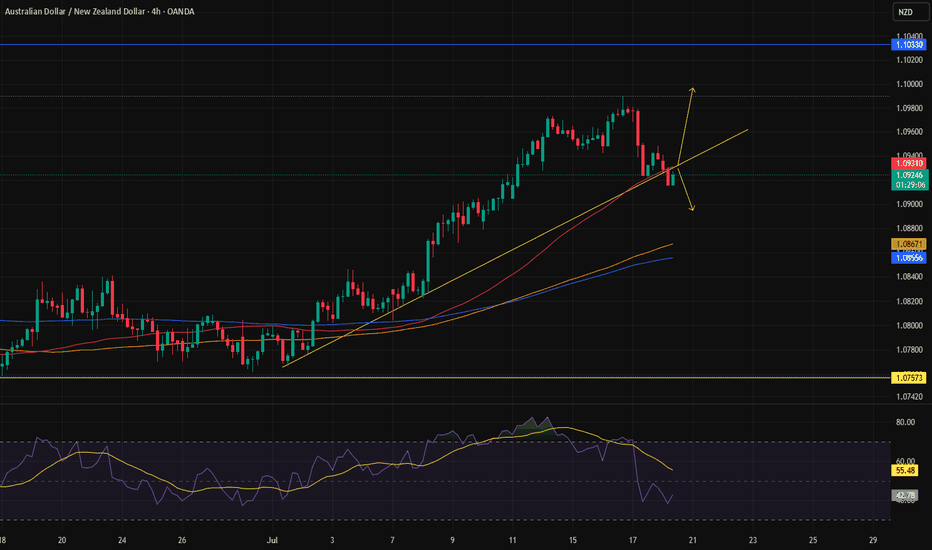
It's really hard to guess, but if it's a fakeout, we'll head for a new high; and if it's a pullback, we might drop down to 720.
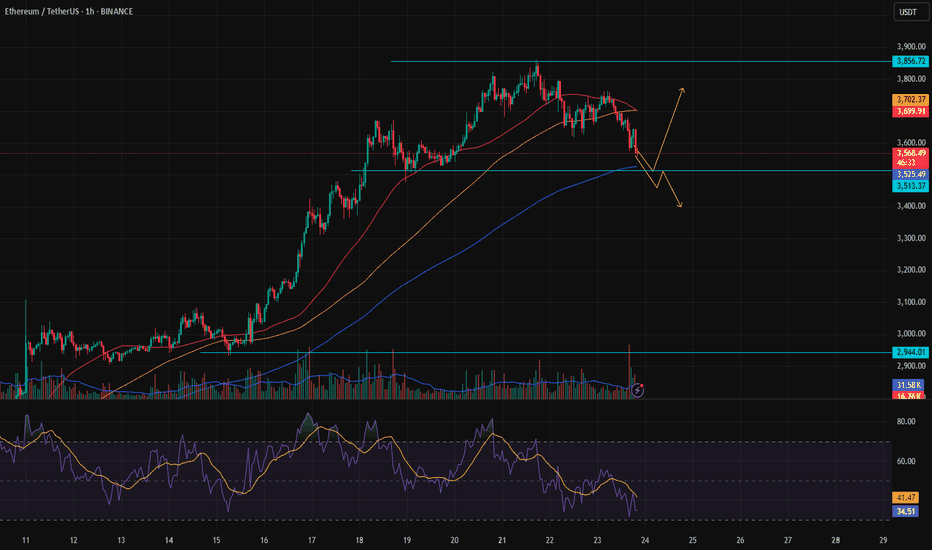
Ethereum is currently in a downtrend, and so far we don't see any signs of a reversal yet. But let’s not forget that in the higher cycle, the trend remains strongly bullish. Now you may ask — when is the best time to buy Ethereum? 3500? Or 3400? We need to wait a bit to get more confirmations before answering that. I’ll share the best buy zone with you soon in the...
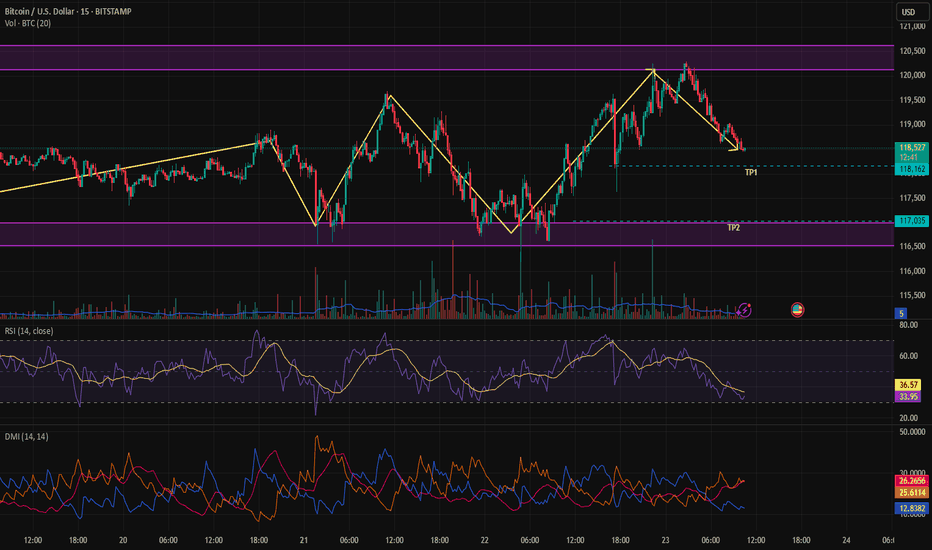
As mentioned in our previous analysis, the price had reached the top of the range. At that stage, we had two options: wait for a confirmed breakout to the upside, or take a reactive position anticipating a move toward the bottom. Now, we are seeing price action moving toward the lower boundary of the range.
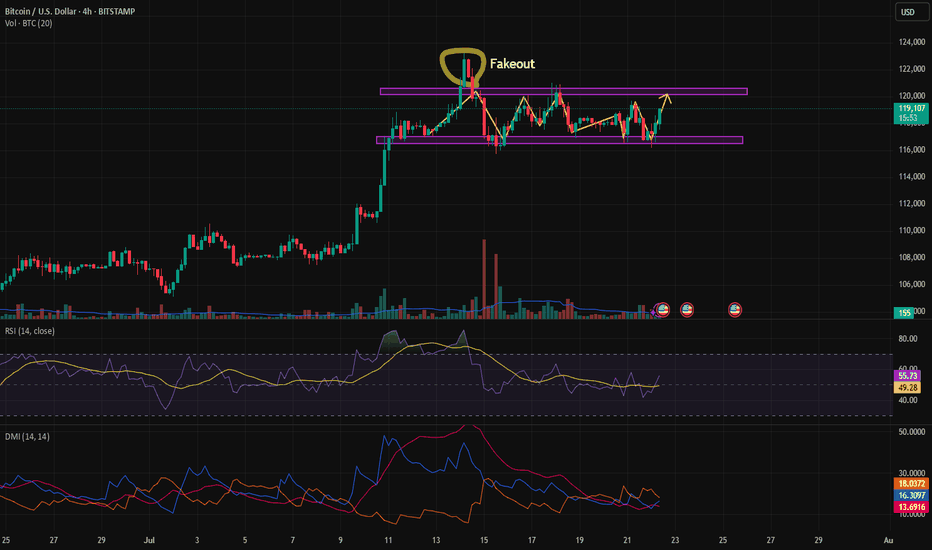
Bitcoin has been ranging for nearly 12 days, and based on range-trading strategies, it's now possible to take a position. There's a high probability that the price will move toward the top of the range. For taking positions near the bottom of the range, we need to wait for a trigger since we're trading against the current direction. In case of a breakout above the...
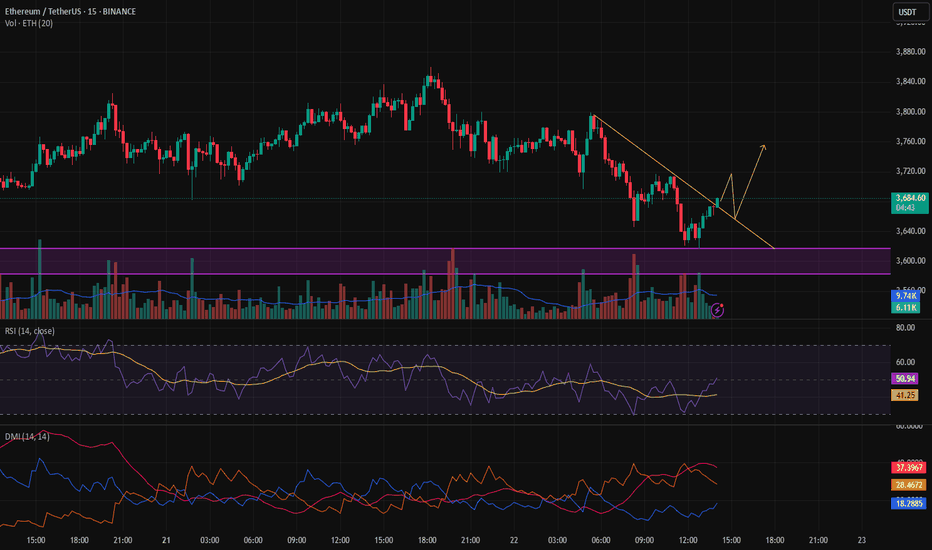
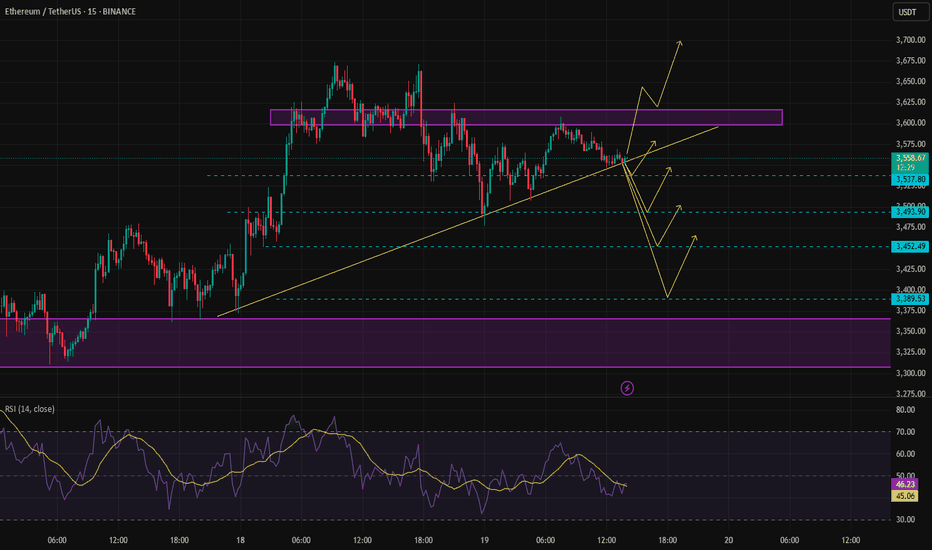
After a step up, Ethereum made a pullback, and a news event released today caused the correction to deepen. So far, we haven’t received any bullish confirmation. If the price pulls back to the marked level and gives confirmation on the 15-minute timeframe, we can look for a buy opportunity.
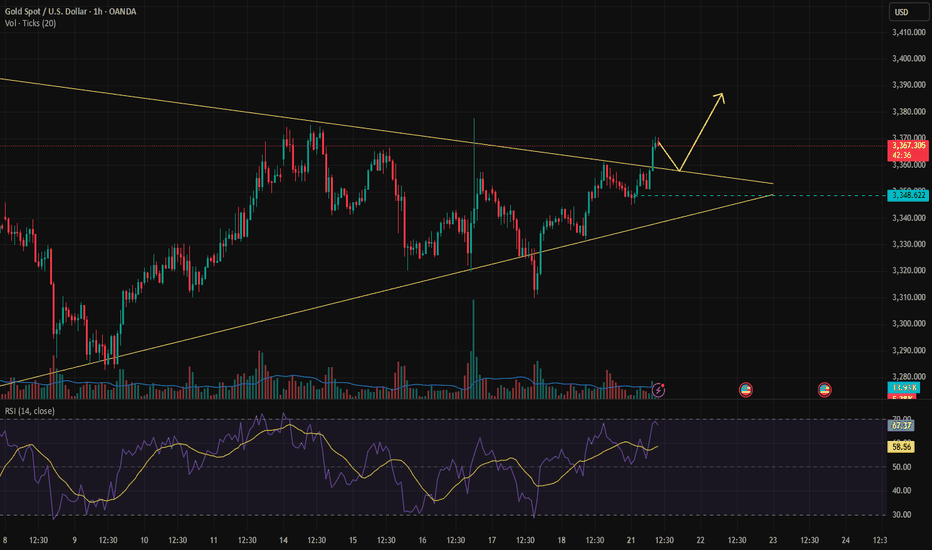
Possible Breakout, But No Confirmation Yet The price compression zone we previously discussed appears to have broken to the upside, but we haven’t seen any solid confirmation yet. If the market gives us a pullback and confirms the bullish direction, we’ll start looking for potential long setups. For now, staying patient and waiting for the structure to unfold.
In my opinion, if Ethereum is going to make a minor pullback, the best entry zones have already been marked with arrows on the chart. However, if the price continues upward without a correction, we should wait for clear confirmation, as the bullish momentum appears weaker compared to the previous move
This week, we’ll be analyzing several currency pairs that are showing promising trading setups. Unlike previous weeks, we plan to focus on lower timeframes and shorter market cycles to take advantage of more agile trading opportunities. If the price manages to give us a clear confirmation within the marked zone, we can start considering a potential shift to a...
The only signal that makes me lean more toward a fakeout rather than a clean pullback is the distance between the 100 and 200 moving averages and the current price. At the moment, price is struggling around the 50 MA, and there’s a clear gap between it and the longer-term averages. We need to give the market some time and see which direction gains confirmation....
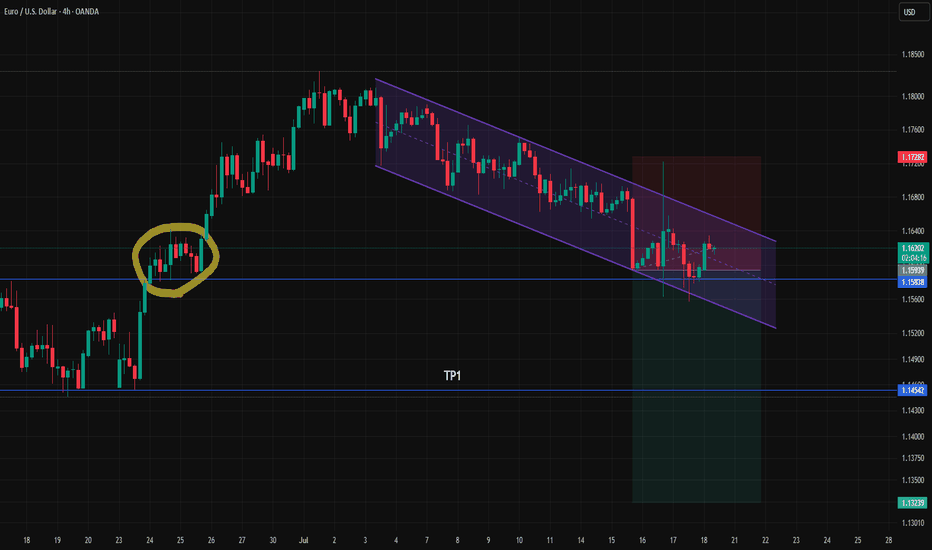
Update on Previous Analysis Since there are no major economic events scheduled for today, we expect lower volatility and a relatively calmer market, unless any unexpected news hits the wires. Looking at the chart, price is still moving within a descending channel, and it's currently reacting around a key zone — an area of previous price congestion that also...
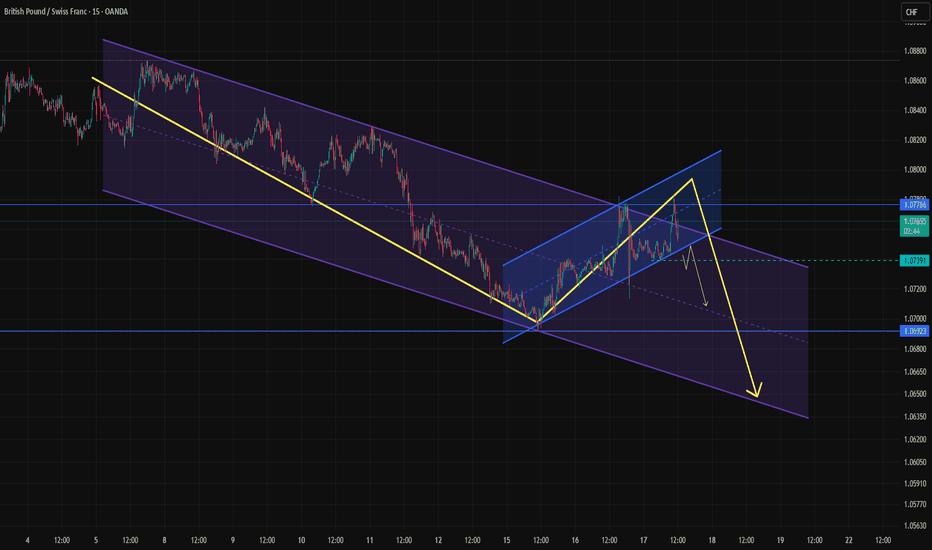
We have a large descending channel, which appears to be forming a smaller ascending channel as part of a correction. Once the correction is confirmed and completed, it could provide a good opportunity for a short position. However, if the lower boundary isn't broken and the price moves higher, we’ll hold off and wait for a new structure to form.
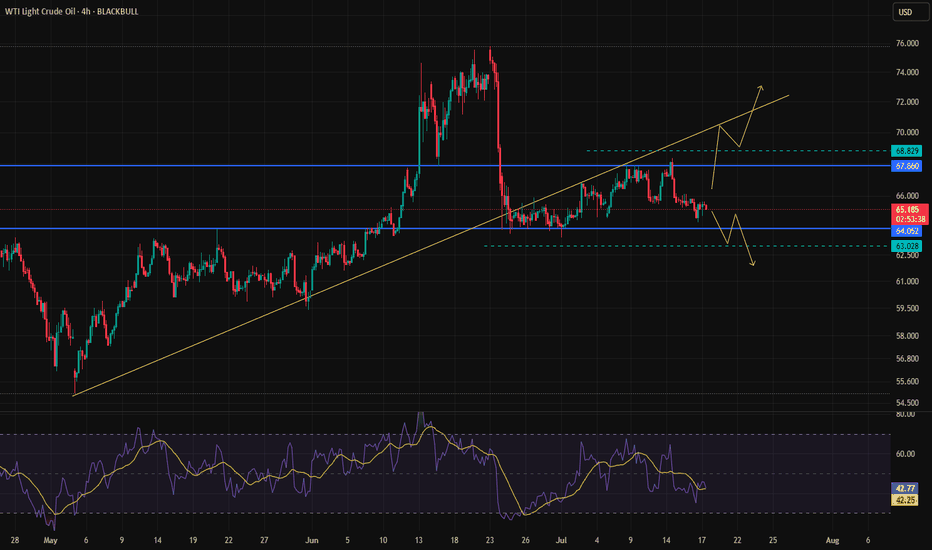
Oil has been stuck in a prolonged range, and a breakout in either direction is becoming increasingly likely. The overall trend remains bullish, as there’s been no confirmed trend reversal yet. 📌 Key Scenarios: A break to the upside would signal continuation of the bullish trend. A break below the range could confirm a potential trend reversal. 📈📉 To avoid...
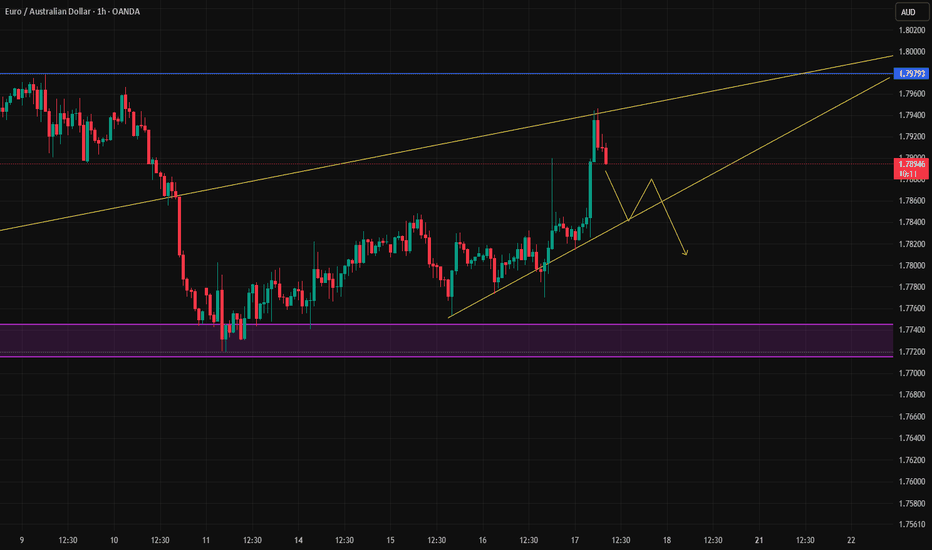
If the euro is indeed set to weaken — as we anticipate based on the current signs of trend exhaustion — this could be a solid trigger for a short position. However, if the breakout fails to confirm, it may turn out to be a fakeout, potentially leading to a bullish reversal instead
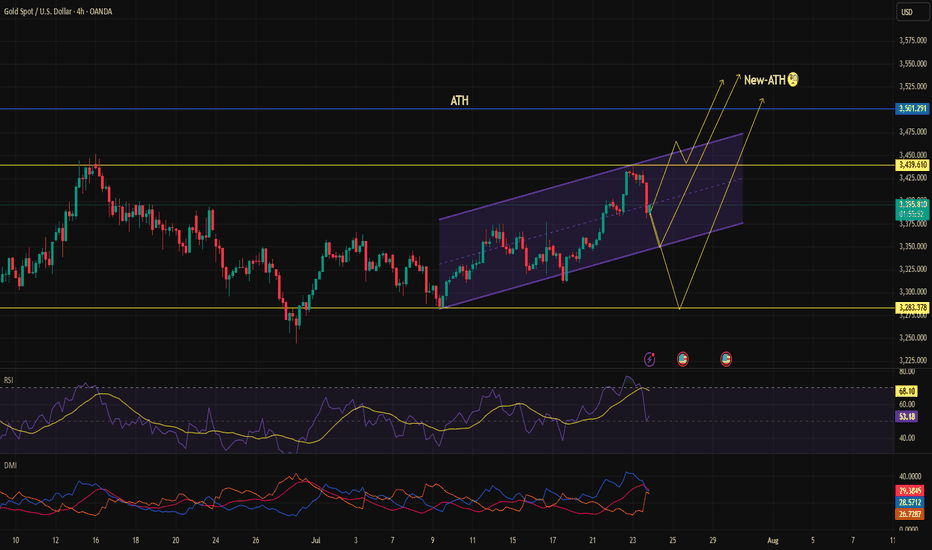
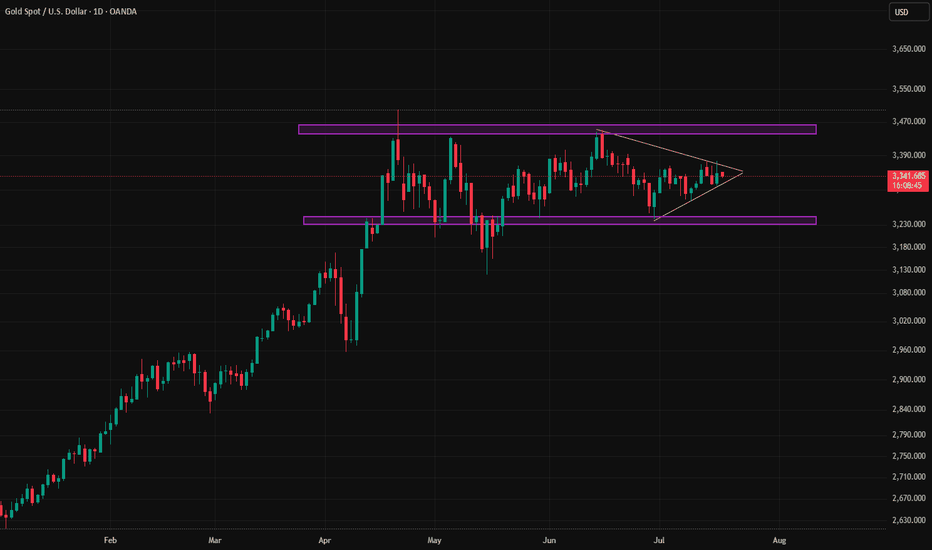
Gold has been stuck in a range for about 92 days, and recently, price action within the range has become increasingly compressed. This tightening suggests that a breakout in either direction could lead to the beginning of a new long-term trend.
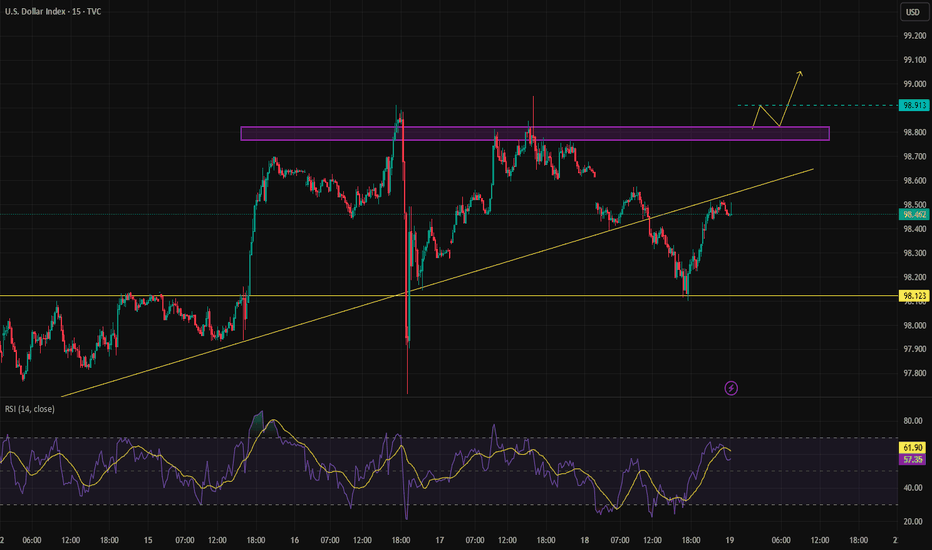
Trump came out with a fake piece of news to create some volatility for himself. But the trend went back to its original path, and in my opinion, the downtrend will likely continue.
