PriceVolumeRider
NSE:IOB Well IOB will face Resistance at 13.75 as per weekly chart and then it will go for 17.3 and then 28.4. one can keep trailing above T2 This view is as per weekly chart so keep in mind holding period must be minimum of 3 Months.
NSE:VRLLOG VRL logistics weekly chart telling something to us. If you can managed to observe the chart carefuly you will see supply is dried out and some demand is now coming in. From last couple of weeks its showing good sign for buying. The only concern I am seeing in this counter is it may test the area of 130-120, but in that scenario to it will be good a...
NSE:BHARTIARTL BHARTIARTL Looks BULLISH on Daily chart. To me BHARTIARTL looks bullish on daily chart. But Why??? read below given Simple no brainer view. Area of 547-587 looks like area of re-accumulation after hitting a new lifetime high. Now today on 13/08/2020 candle form right below the area of re-accumulation which was mention above, but candle not...
NSE:SUNPHARMA SunPharma on daily chart one could say it is given a breakout to Flag Pattern, but but should see bigger picture here befor going long from here or hoping for more (those who are already in from lower level) If one could observe the daily and weakly chart find 529 as a strong resistance. And as far as flag breakout is concern, after breakout its...
NSE:PIDILITIND PIDILITE on daily chart taken a goods support and showing reversal. Whats looks interesting here is the price and volume movement at its support level one can check the chart and observe the same. There is nothing too much complicated here everything is just nice and simple as I expected. For positional traders its looks bullish on daily chart...
NSE:AMBUJACEM AMBUJACEM on weekly is strong enough to consider it for long term. Price and Volume Favourable.
NSE:IBULHSGFIN Though IBULHSGFIN show selling in last trading session (31/07/2020) chart is indicating some strength left in this counter. If you can see on 1H chart stock was trading on low volume from past few sessions and was in sideways trend. On Friday's trading session stock did fall with decent amount of volume (you can see on daily chart). These kind...
NSE:BANDHANBNK Bandhan bank on daily chart getting weaker. On daily chart if we manage to see closing below 330 (Candle Must close near its low) Then stock may show free fall from there. This will become invalid above 370. This is just my personal view on BNADHAN BANK do not consider this as trade recomandation. Please don't hesitate to share your views in...
NSE:HCLTECH If you can see HCLTECH getting narrowing down its movement as its going up. And last couple of days its also not showing any strong bullish closing on Daily and 1H chart. Volume is also indicating professionals are now not interested in higher prices. We may consider this as weak stock now which may fall or best say it will show some retracement...
NSE:SRTRANSFIN If you see daily chart of SRTRANSFIN chart is showing good supply. As one can see on 1H chart after breaking out the resistance area of 689 stock not managed to sustained above the same and fall and break the support of 689 (Resistance Become Support). Seeing such scenario we can say Profestionals trapped breacout traders. After breakingdown ...
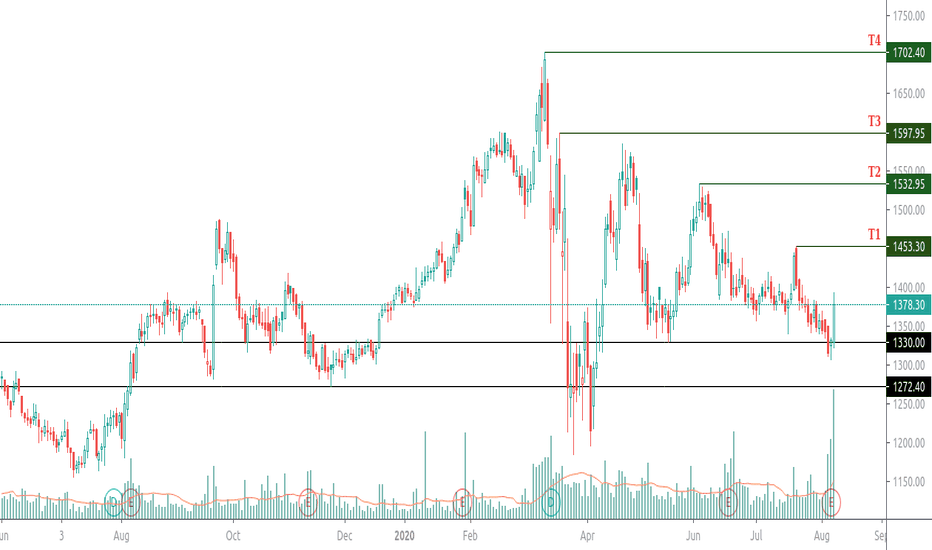
NSE:SBIN SBIN trading in uptrend channel and today stock taken out its last swing high and sustain above it. I am considering SBIN for swing trade with SL of 181 closing basis. I am looking for target of 197 first and if SBIN hold strong that level then may be 202++ also possible.
NSE:HDFC HDFC on 2H looks bullish for swing trade. If any 2H any candle closes above 1825 then we can consider this for long for swing trade. I will prefer to keep my stop loss at 1750 closing basis which was last swing low. Expected TARGETS for this trade will be 1947 and 2024. Making HH HL formation Hence considering this for long.
NSE:BAJFINANCE On 2H chart BAJFINANCE started to becoming weaker. Stock facing good resistance between the range of 3320-3420 while 3125 will be immediate Support for stock. On 2H chart if stock manage to breakout 3420 with good volume and candle closing near high it will open for fly for target of 4040. But if the stock breaksdown 3125 it will then likely to...
NSE:BHARATFORG BHARATFORG on 2H chart become bearish. Any high volume candle closing below 353 will confirm the short trade here. In coming trading sessions if I see any 2H candle closing below 353 I will prefer to short it with Stop Loss of 385 for Target of 309/277
NSE:TORNTPHARM On 15M chart we can see stock is forming HH HL from last few trading sessions. In last trading session (10/07/2020) after making new HH stock breaks down previous HL but volume was low for that breakdown and range was also narrowing down. In last 30-45 minutes of trading sessions we can see volume was increasing with price and price range was...
NSE:INFRATEL Bharti Infratell on monday if goes below 208 then it will be showing bearish trend. I will consider it to short below 208 with SL 212. FOR Targets I will follow fib Extensions
NSE:SUNPHARMA Sunpharma on 2H chart looks bullish above 484 for swing trade. Possible targets for this trade will be 490,495 and 503 I prefer to keep my stop loss near 471. Both my entry and exit will be as per 2H candle closing basis.
NSE:INFRATEL Infratel showing no demand for higher prices on 2H chart and rejecting from higher levels. Its also tested 21MA and shown good rejection from there too. And now trading well below it. I will be looking for short this below 203 2H candle closing basis with SL of 218. This view is for short term (2-3 days) swing trade and intraday.


