RCT8
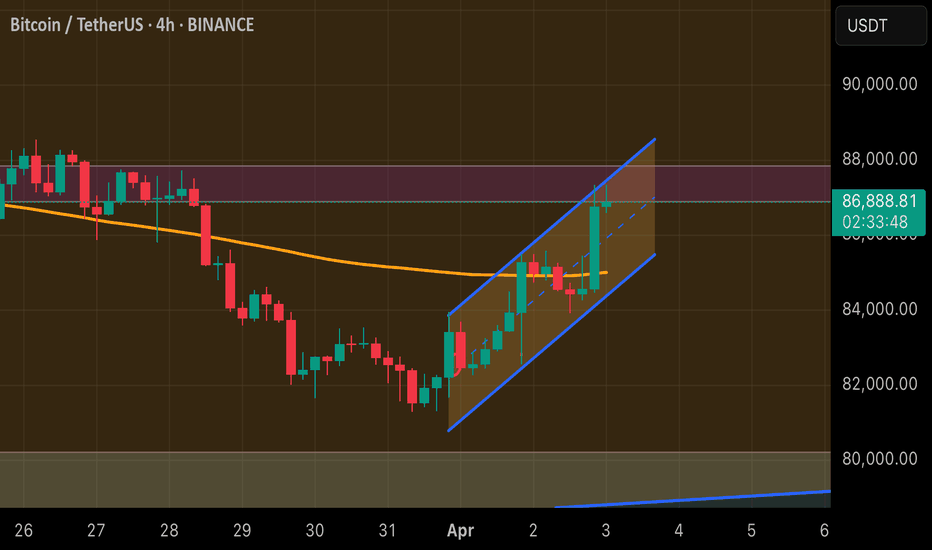
Hello Everyone, Greetings, BTCUSDT 4H | As we can see together, BTCUSDT is experiencing a rebound in the WEEKLY trendline resistance area & WEEKLY FVG. If we observe further, we can also see the 200 Moving Average (MA) at the $84,000 area, and there’s also a Triple Bottom marked with a red circle. So it can be assumed that the BTCUSDT market is likely to...
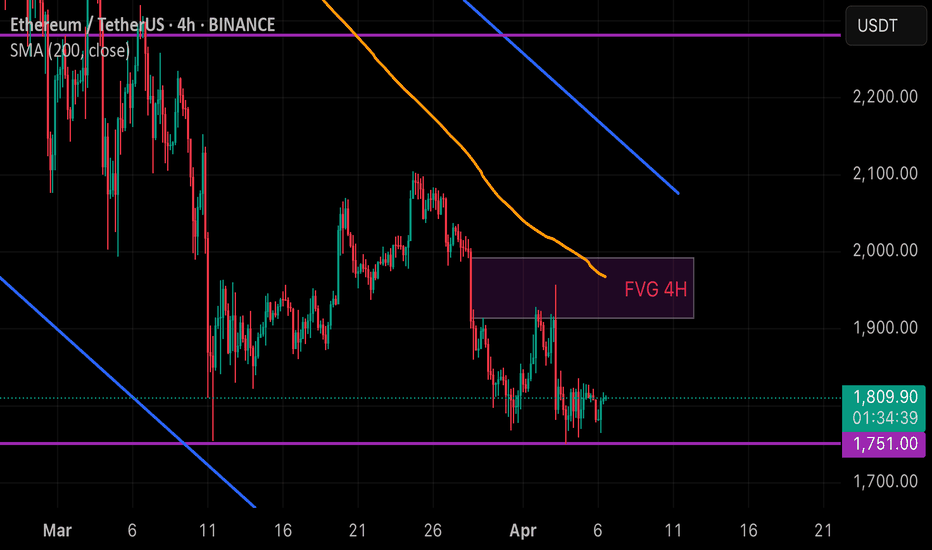
From the ETH/USDT (Ethereum) chart on the 4H (4-hour) timeframe you see, here’s a brief analysis of the support and resistance levels based on the existing price structure and horizontal lines: 1. Support: • Main support around $1,751 This is visible from the purple horizontal line and previous price reactions that rejected further downside in this...
Hello everyone, Greetings As we can see XAUUSD is still UPTREND, but in short term after hit ATH abit correction down cause of TRUMP Tariff in the news today. also XAUUSD is near MA200 in Time Frame 1H this just analysis not for entry. Remember trading is high risk, do your own research
Hello everyone On the previous post, we talk about FVG, Support & Resistance BTCUSDT And now btc confirmation reverse the trendline with this strong break we hope btc keep on lower to get biggest support around $80,000 - $76,677 Remember do your own research
From the BTC/USDT chart (4H, Binance), here is the analysis of the strongest and closest support & resistance levels: 1. Nearest & Strongest Resistance: • The zone around $87,500 - $88,000 (marked with the red area above the current price). • This is a supply (resistance) area that has previously been a price reversal point. • If the price breaks through this...
Hello Greetings, Update, as i mention earlier on the previous post about scalp/intraday BTCUSDT already hit half of FVG Daily remember do you own research choose what style do you used to trade manage your own Risk & Reward
Hello, greetings everyone. First of all, I would like to thank you for taking the time to review my simple analysis as a newbie hehe. For SCALPING or INTRADAY style trades, hmm, personally I always look for where the 200 Moving Average (MA) is. Why 200? The 200 MA can be considered the strongest level for support or resistance, so I tend to enter around the...
Hello, greetings everyone. First of all, I would like to thank you for taking the time to review my simple analysis as a newbie hehe. As you can see, BTCUSDT, on a weekly chart, is still within an uptrend trendline and is around the lower trendline (support). In conclusion, I am only analyzing the current market condition, with no intention of an entry....
Hello, greetings everyone. First of all, I would like to thank you for taking the time to review my simple analysis as a newbie hehe. As you can see, BTCUSDT, on a weekly chart, is still within an uptrend trendline and is around the lower trendline (support). Meanwhile, BTCUSDT, on a daily chart, is in the Fair Value Gap (FVG) area and can be said to still be...
As seen, there is a clear DESCENDING BROADENING WEDGE pattern, with strong support around the 92K area, where the price has bounced several times. For resistance or TP zone it's at the yellow line or 102.800. BTW, DYOR (Do Your Own Research) Cheers!


